When natural disasters strike, the size of the impacted area can affect how prepared you need to be for the aftermath. Co-occurring and cascading hazards also impact that effort. The more destruction, the longer it may take for emergency responders to help you and your loved ones. We know that a Cascadia Subduction Zone megathrust earthquake will be paired with a devastating tsunami. For more information about what tsunamis are, the expected impacts from a CSZ tsunami, and how to survive one, visit Surviving Cascadia’s Tsunami page. But what else is the region likely to face?
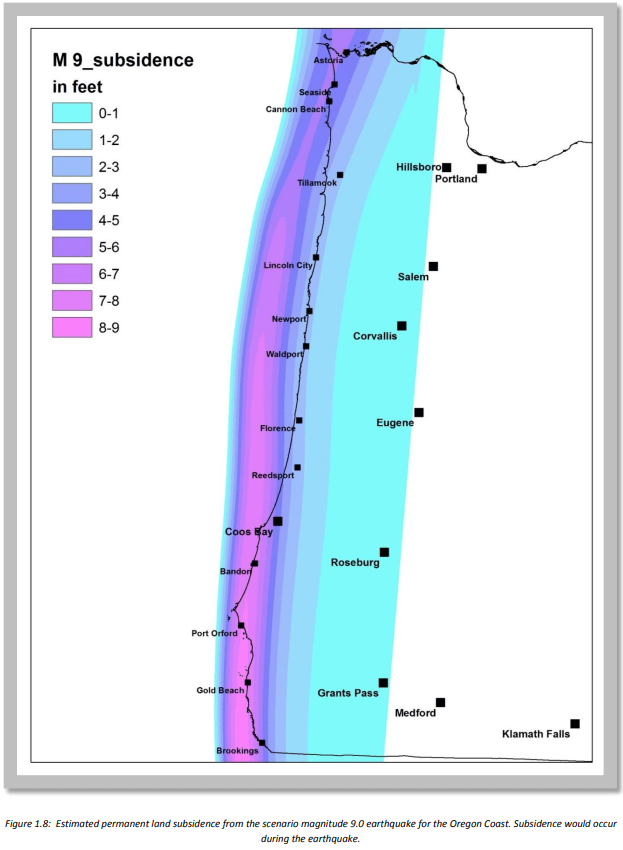
The shaking will likely cause an immediate and permanent drop in elevation along much the western edge of the North American Plate—a phenomenon known as co-seismic subsidence.
An April 28, 2025, research publication, Increased flood exposure in the Pacific Northwest following earthquake-driven subsidence and sea-level rise, highlights some long-term impacts of subsidence. The research states:
“[T]he next great Cascadia subduction zone earthquake could cause up to 2 m of sudden coastal subsidence, dramatically raising sea level, expanding floodplains, and increasing the flood risk to local communities.”
Through climate change considerations of sea level rise, the research found:
“[S]ubsidence from a great earthquake at Cascadia today could double the flood exposure of residents, structures, and roads. By 2100, earthquake subsidence amplified by projected climate-driven sea-level rise could more than triple the flood exposure of residents, structures, and roads.”
Below is a briefing document of the research.
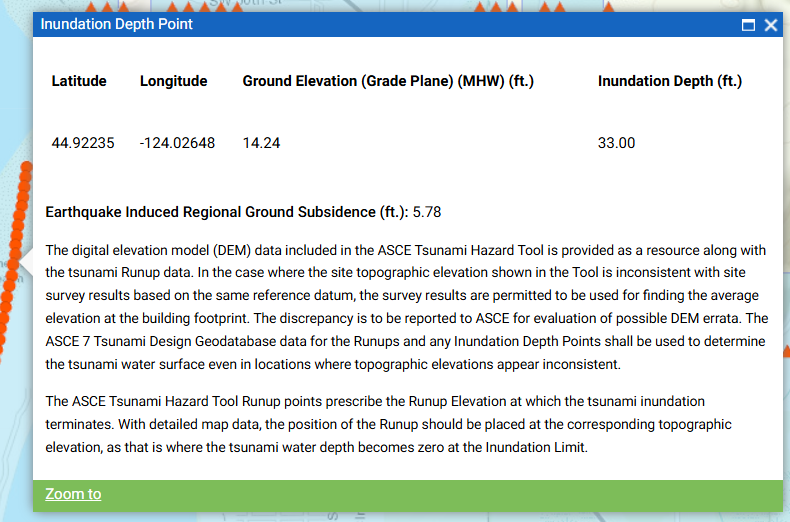
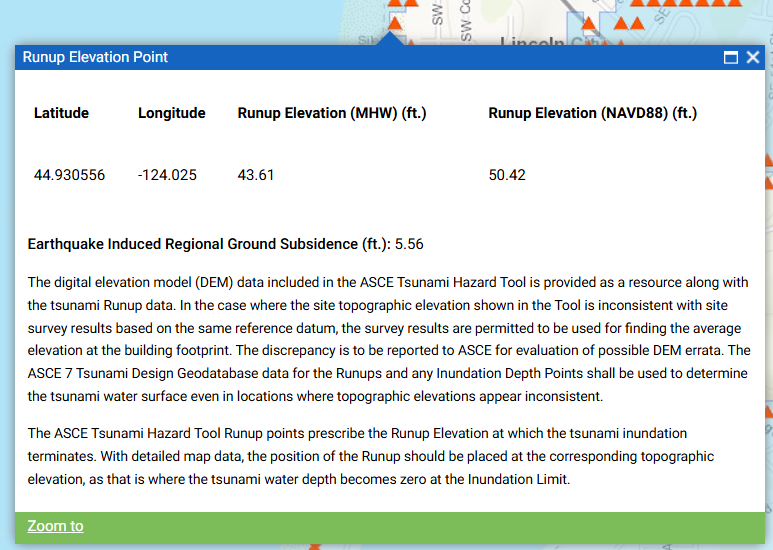
For those curious about how far the land is expected to subside in a given location, visit the ASCE Tsunami Hazard Tool. Clicking on a red circle, as shown below on the left, provides 1) ground elevation, 2) inundation depth, and 3) ground subsidence level. Clicking on a red triangle (right image below) provides 4) runup elevation and ground subsidence.
To obtain current elevation levels for areas along the coast not shown under the “red dots” on the ASCE Tsunami Hazard Tool above, visit the ASCE Hazard Tool and select Tsunami as the hazard of interest for a given location. It will provide the summary report below and can provide a printable PDF.

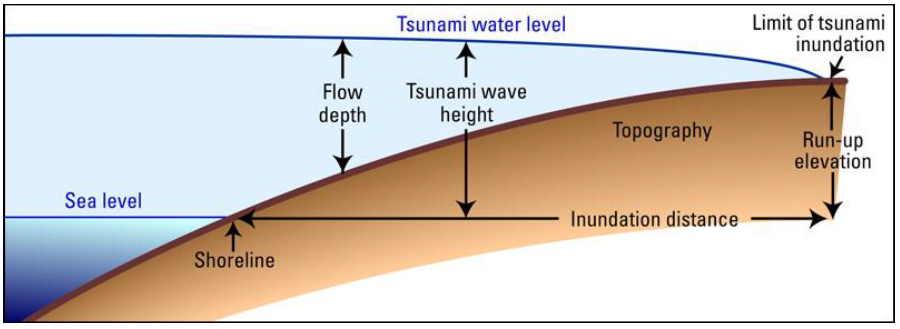
Here are a couple of images to help explain tsunami terms.

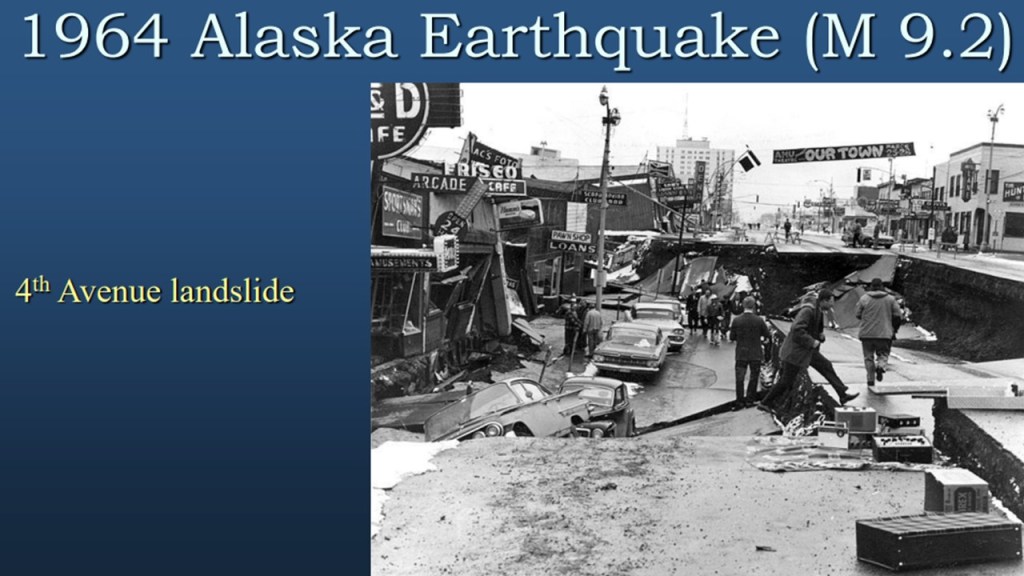
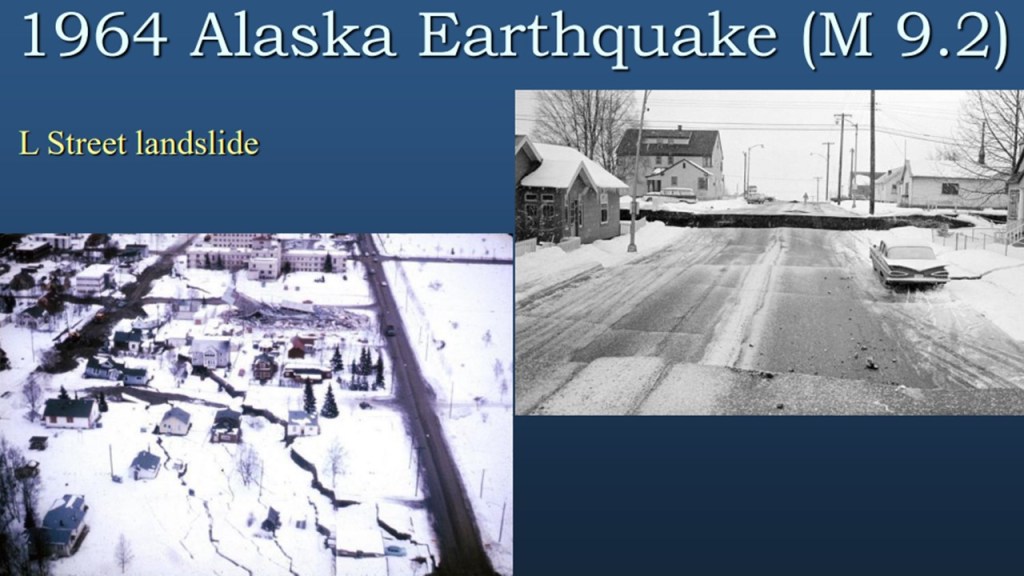
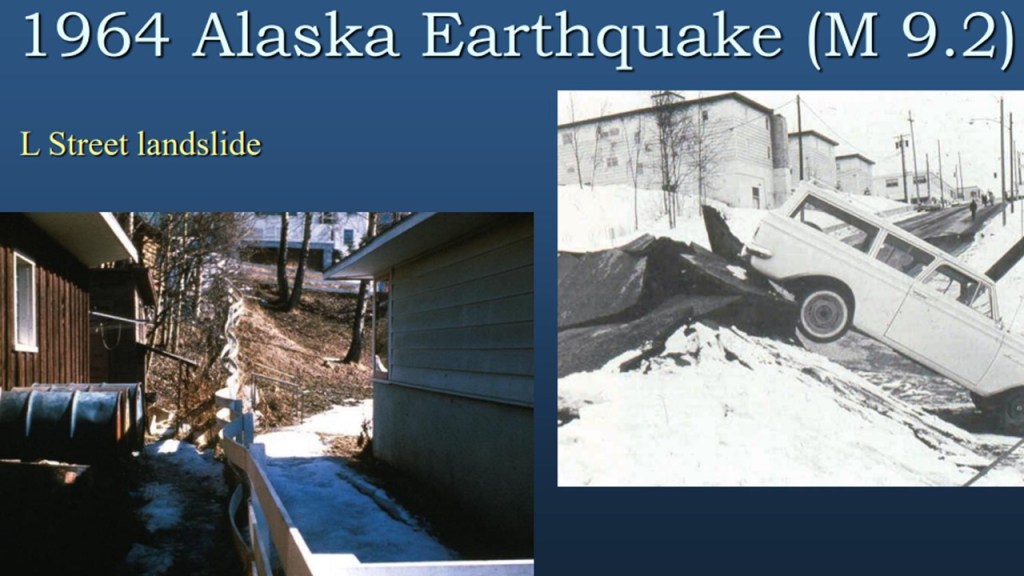
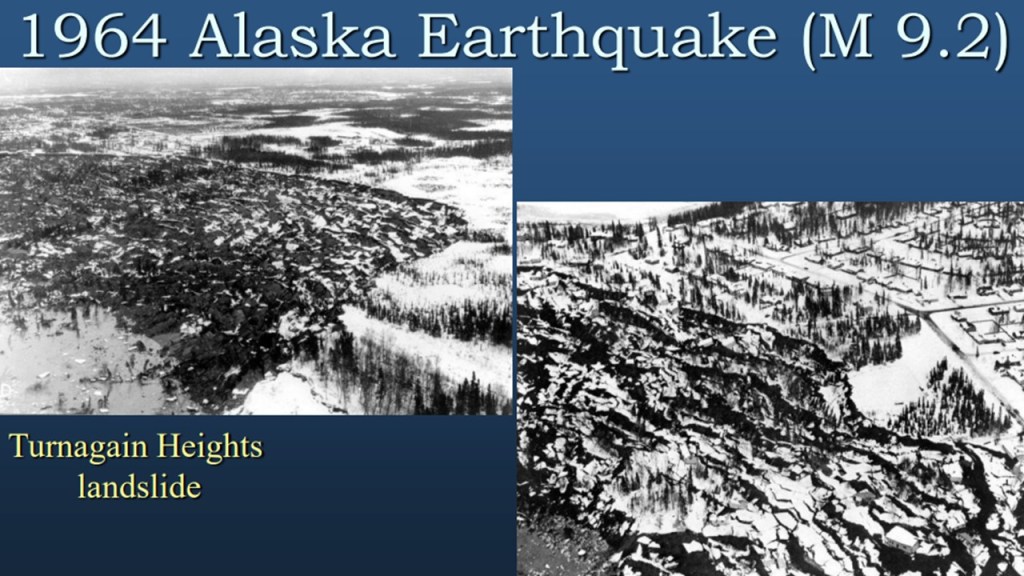
According to the United States Geological Survey (USGS), “landslides can be initiated in slopes already on the verge of movement by rainfall, snowmelt, changes in water level, stream erosion, changes in groundwater, earthquakes, volcanic activity, disturbance by human activities, or any combination of these factors.”

These landslides can destroy buildings and infrastructure, injure people and animals, and render evacuation and other transportation routes impassable. This image from Washington State University shows different types of landslides. In October 2024, the USGS released a GIS-based landslide inventory map that lets you view your risk at any location across the US.
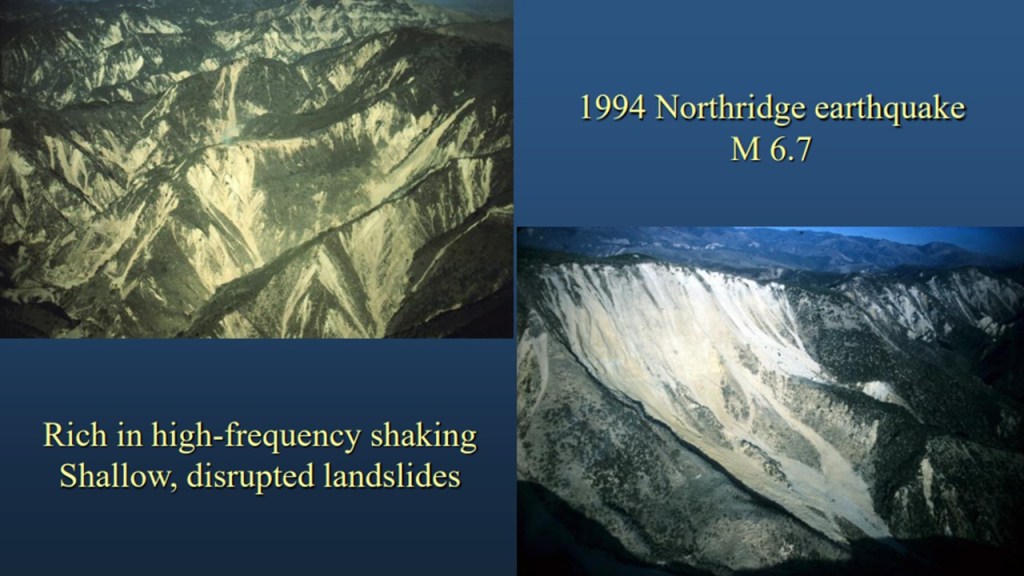
The slides below are part of a USGS Presentation titled Landslide Hazards Associated with Subduction-Zone Earthquakes. It was presented at the Geological Society of America (GSA) Annual Meeting in 2017.


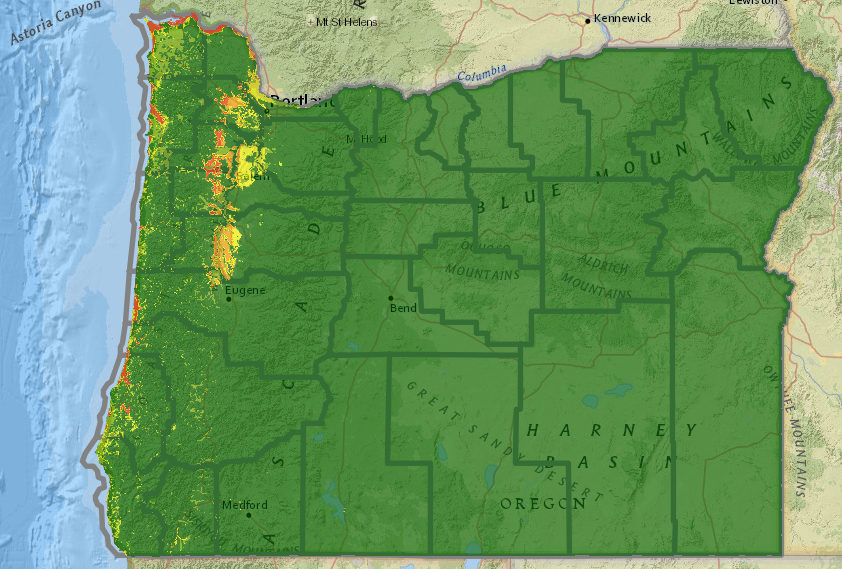
Oregon State University’s O-Help system shows landslide risks across Oregon. Their webpage allows users to zoom in and view the risk at a specific location (home, workplace, school, place of worship, etc.).

The Oregon Department of Geology and Mineral Industries (DOGAMI) hosts the Statewide Landslide Information Database for Oregon (SLIDO). The map offers similar functionality for viewing location-specific hazards. Be patient with the map. It’s a lot of data to display, and it may take a minute to load.
According to the USGS, the CSZ-anticipated risk shown in the image on the right is a phenomenon in which saturated sand and silt behave like a liquid during intense earthquake shaking.
“Liquefaction occurs when shaking breaks the friction bond in the soil structure and causes groundwater to act as a lubricant. The soil loses its bearing capacity and temporarily becomes like quicksand. This causes foundation failures and can destroy even code compliant structures. All structures in softer soil regions of the Planning Area are at risk… Liquefaction will begin as soon as the ground starts shaking. It may eject water and soil material from the ground (sand blows), destroy foundations, destroy roads, bridges and culverts, cause buildings and vehicles to sink, float underground utility structures and pipes to the surface and make walking or driving impossible. Magnified shaking and liquefacted soil will delay evacuation during the critical minutes before the tsunami arrives. “
Cape Flattery School District Hazard Assessment and Mitigation Plan
This image was part of a University of Washington Presentation titled A Primer on Paleoliquefaction Inverse Analysis and its Research Potential in Cascadia. It was presented at the Geological Society of America (GSA) Annual Meeting in 2017.

Like the landslide image from the section above, the image below, from Oregon State University’s O-Help system, shows liquefaction risks across Oregon. O-Help provides landslide, liquefaction, and shaking-intensity risks down to the user’s address. Knowing these risks helps you plan!
An October 2023 Portland State University-led paper, Risk of Earthquake-Induced Hazardous Materials Releases in Multnomah County, Oregon: Two Scenarios Examined, states:
“Liquefaction and displacement threats to the CEI Hub are greatest for the facilities nearer to the river, with displacement estimates as high as 23 feet. Facilities located further from the river will experience less ground deformation, likely between 3 and 12 feet (DOGAMI, 2018).”
In addition to listing recommendations and actions that individuals, organizations, and governments can begin implementing to mitigate this cascading hazard, it provides the following details. It’s well worth the read. Notably, this paper examined impacts from only 4 tank failures. This is not a worst-case scenario.
- 90% of Oregon’s fuel supply
- Majority built before the 1970s to deficient code requirements, built on soil highly susceptible to liquefaction
- Potential for the release of between 95 and 194 million gallons of petroleum products
- Would rank among the largest oil spills in American history, 43% may flow into the Willamette River, 65% are light oils (e.g., gasoline or jet fuel), 25% are medium or heavy oils (stay in the environment until cleanup occurs)
- Summertime release scenario: 330,000 irritation level exposures >17,000 potential injuries, 2,500 potential deaths
- Wintertime release scenario: >100,000 irritation level exposures >18,000 potential injuries, >1,100 potential deaths

There are dams throughout the state that were built before knowledge of the CSZ—before understanding the hazards. Some of the dams are at risk of failure during shaking. Below are a few examples. One of the best websites to view for hazards around US dams is the US Army Corps of Engineers National Inventory of Dams.
According to the American Society of Civil Engineers’ 2024 Report Card for Oregon’s Infrastructure, “Seismic (earthquake) risk in Oregon due to the Cascadia Subduction Zone earthquake event is extremely different from the previous understanding of seismic risks in Oregon. Dams that are designed for a peak ground acceleration of 0.05g, equivalent to light shaking expected to rock parked cars, now must withstand 0.6g to 1.2g, equivalent to violent shaking expected to shift buildings off their foundations. Most dams in Oregon were constructed before modern seismic provisions, and several require seismic retrofits. Damage and dam failures are expected at many dams along the Oregon coast during the Cascadia Subduction Zone event.”
Oregon’s Department of Emergency Management provides a statewide Comprehensive Emergency Management Plan (CEMP) with 4 parts; Volume I – Natural Hazards Mitigation Plan (NHMP), Volume II – State Preparedness Plan, Volume III – Emergency Operations Plan (EOP), and Volume IV – State Recovery Plan. Within Volume II is the Hazard Identification and Risk Assessment. Section 3.3.6 contains information about Dam Failures.
IA 0 – Oregon Hazard Identification and Risk Assessment (OHIRA) & IA 3 – Flood (including Dam/Levee Failure) are available in Volume III, and also contain information on the topic. All three documents are available through the link above and are provided below.
Tillamook County
Tillamook County has two (2) high-hazard dams, Barney Reservoir, located at the headwaters of the North Trask River, and the McGuire Dam, located at the headwaters of the Nestucca River… In the event of a Cascadia Subduction Earthquake, both dams have a very high probability of failure.
Tillamook County Hazard Analysis
Coos County
A recent seismic engineering investigation of the [Lower Pony Creek] Dam completed by a geotechnical consulting engineering firm identified a loose sand layer below the dam. It is likely this material may liquefy in a Cascadia Subduction Zone Earthquake. OWRD is currently doing an all-risks assessment to compare this dam to other HHPD-eligible dams in the state. Based on the preliminary investigation, there is a reasonable likelihood that the dam could fail in a Cascadia Earthquake… Under current conditions, failure appears to be likely in such an event and would result in catastrophic loss of life and also loss of all water supplies for 25,000 people.
Coos County Multi-Jurisdictional Natural Hazards Mitigation Plan
Marion County
Total failure of the Detroit Dam, with a full reservoir, would cause the smaller Big Cliff Dam to fail also and would inundate Gates, Mill City, Stayton, Aumsville, Turner, and Jefferson, as well as cause significant portions of Salem and Keizer to be flooded. Failure of the Detroit Dam is considered very low; however, if it were to fail, 65-70,000 people would be at risk, and damages could well exceed $500 million dollars… The County’s population has 326,110 residents covering 1,182.33 square miles.
Marion County Emergency Operations Plan (EOP)
In 2020, an updated seismic hazard analysis was completed for Detroit Dam to better understand the potential earthquake ground motions at the site. This hazard study has been used to analyze the performance of the spillway gates and found the risk to be higher than previously assessed. The performance of the spillway gates in an earthquake is a function of the potential ground motions due to an earthquake, the height of the gates above the dam foundation, and the water level acting on the gates at the time of an earthquake. Structural analysis of the spillway gates has shown there is a possibility for buckling of the spillway gate’s supporting arms resulting in an uncontrolled release of water from the dam.
US Army Corps of Engineers: Detroit Dam IRRM Pool Restriction
Curry County
The [Ferry Creek] dam is owned by the City of Brookings on the south coast. Based on a geotechnical investigation conducted as part of a feasibility study, the dam will experience severe deformation in a Cascadia subduction earthquake.
Curry County Multi-Jurisdictional Natural Hazards Mitigation Plan
“Fungus called Cryptococcus gattii (can be fatal) that typically grows on rotting wood in tropical rainforests suddenly appeared in coastal forests across the Pacific Northwest.”
- Fungus originated: Port city of Recife, Brazil
- Fungus traveled to Vancouver in cargo ship through ballast water
- Lived in the ocean for decades
- Tsunami of 1964 spread the fungus up and down the entire PNW coastline
- Fungus adapted to land life again & sickened someone in 1999. It’s still present.
Did you know the Office of the Director of National Intelligence (DNI) has five scenarios for their Global Trends 2040: Charting the Future Amid Uncertainty? It’s worth getting a feel for where things could be headed. Click the links to read the scenarios:
Charting the Future Amid Uncertainty Main Page
A World Adrift
Separate Silos
Tragedy and Mobilization
Competitive Coexistence
Renaissance of Democracies.
Can you imagine how the US’s capability to respond to Cascadia might differ in each of these situations? The scenarios above have long-term implications, but let’s look at what things might look like even if the earthquake struck this year.
You can see the direction a tornado is moving, can watch it shift direction. You can see floodwaters rise, and landslides and avalanches flow. You can see the volcano that’s spewing, the thunderclouds approaching.
You won’t see the earthquake. It will be nowhere, then everywhere at once. There isn’t an earthquake season, and aside from the precious few seconds that ShakeAlert can now bring, there will be little warning. You have to be ready in advance. Knowledge is power, and hopefully, in this case, it’s motivation, too. Just be ready.
