Within the area expected to be impacted by a Cascadia Subduction Zone (CSZ) earthquake, only 5% of the population is estimated to be 2-Weeks-Ready. Income, language barriers, and apathy play a role in why that number isn’t higher. Another factor, according to Dr. Howard Kunreuther, Co-Director of the Wharton Risk Management and Decision Processes Center, University of Pennsylvania, is temporal myopia, part of our human nature that often leads us to prioritize short-term (nearsighted) over long-term benefits when making decisions. His FEMA Prep Talk is worth watching.
The way we discuss the likelihood of a major Cascadia earthquake plays a major role in whether we believe the risk lies just around the corner (short term) or far in the distance. That belief goes a long way to determining how much time, money, and effort we dedicate toward preparing for the event.
The discussion typically starts with a question we have all asked—what are the chances that this thing will happen? The most common answer we hear is:
“There is a 37% chance that a magnitude 8.0 or greater Cascadia megathrust earthquake will occur in the next 50 years“
Framing the CSZ risk in a 50-year timeframe makes that risk easy to dismiss the hazard altogether or at least push off planning for it—largely due to that temporal myopia mentioned above. By the end of this page, it’s my hope that you won’t base your risk perception on the “37% chance in 50 years” statement. Before I can do that, though, let’s look at where the number comes from.
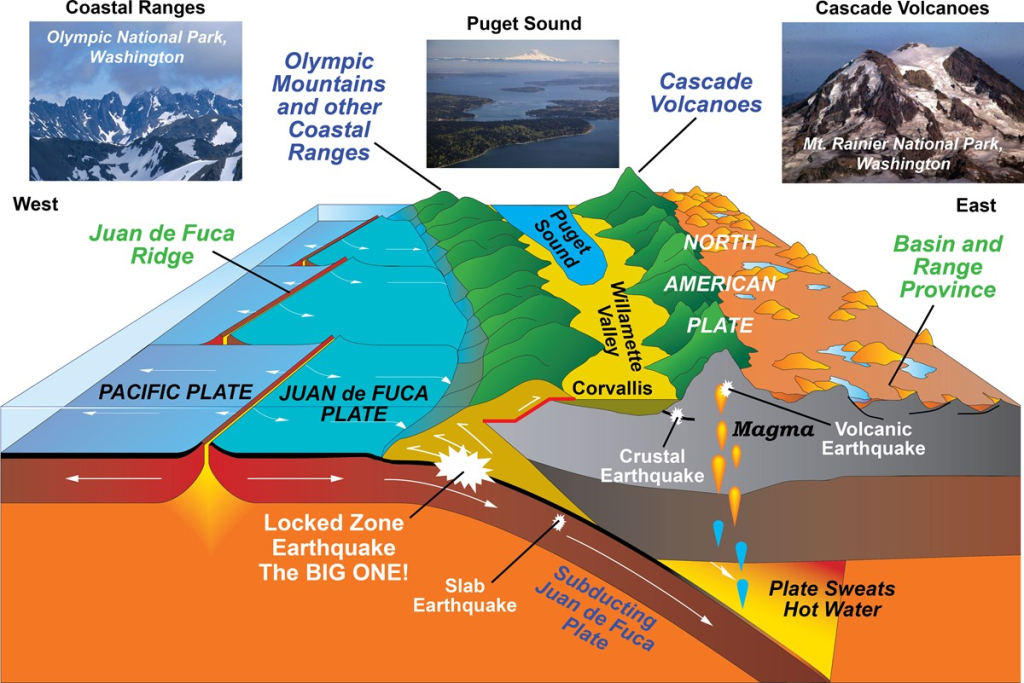
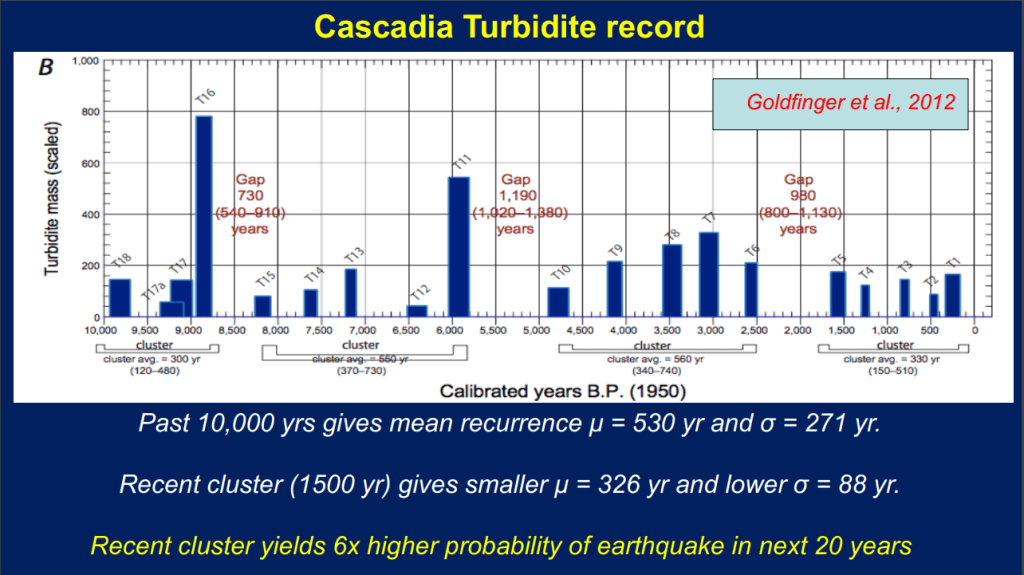
Where does the “37% chance of a CSZ magnitude 8.0+ earthquake occurring in the next 50 years” probability come from? The probability was first published on page 2 of the 184-page USGS publication, Goldfinger et al, 2012. Events, estimated dates, and magnitudes of past CSZ earthquakes are listed in Tables 8 & 10 within the publication and are the basis for the probability.
Now for the fun (and more relevant to our daily lives) questions.
This section allows you to input different timeframes, so you can find answers to questions like those listed below.
- How does that risk change over time?
- “I don’t want a 50-year outlook. Instead, I want to know the likelihood of the earthquake occurring by the time…
- I retire”
- My kids graduate high school”
- I start my own business”
To find learn the answers, download the 37% Calculation Worksheet below, provided by Oregon State University Professor Chris Goldfinger and his team. Edit the “Start Year” and/or “End Year” (inputs in red) to see how the probabilities (outputs in blue) change over time. *Hint: the probabilities don’t change much over time if you keep the 50-year outlook. See the next section for details.

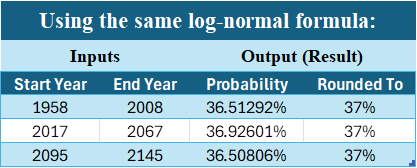
*The Gaussian (normal distribution shown on the right of this image) and Log-Normal (shown on the left of the image) results are shown in the image above for 50-year outlooks, with a start year of 2026. The log-normal equation rounds up to 37%, and according to Professor Goldfinger, that model fits the data for our region better, but the Gaussian model (think bell curve) is better at predicting over time.

“Risk perception refers to people’s subjective judgments about the likelihood of negative occurrences such as injury, illness, disease, and death.”
(Paek et al 2017)
There are a few reasons why the log-normal model provides a SKEWED Risk Perception.
Assumptions
Let’s pretend that:
- Back in 1958, the scientific community had the same information regarding historical Cascadia earthquakes as they do now (age estimates and number of occurrences)
- They used the same log-normal model from above for evaluating risk within a 50-year timeframe.
- The information regarding historical Cascadia earthquakes stays the same, and the region does not have a major Cascadia earthquake by the year 2095.
Three Critical Issues
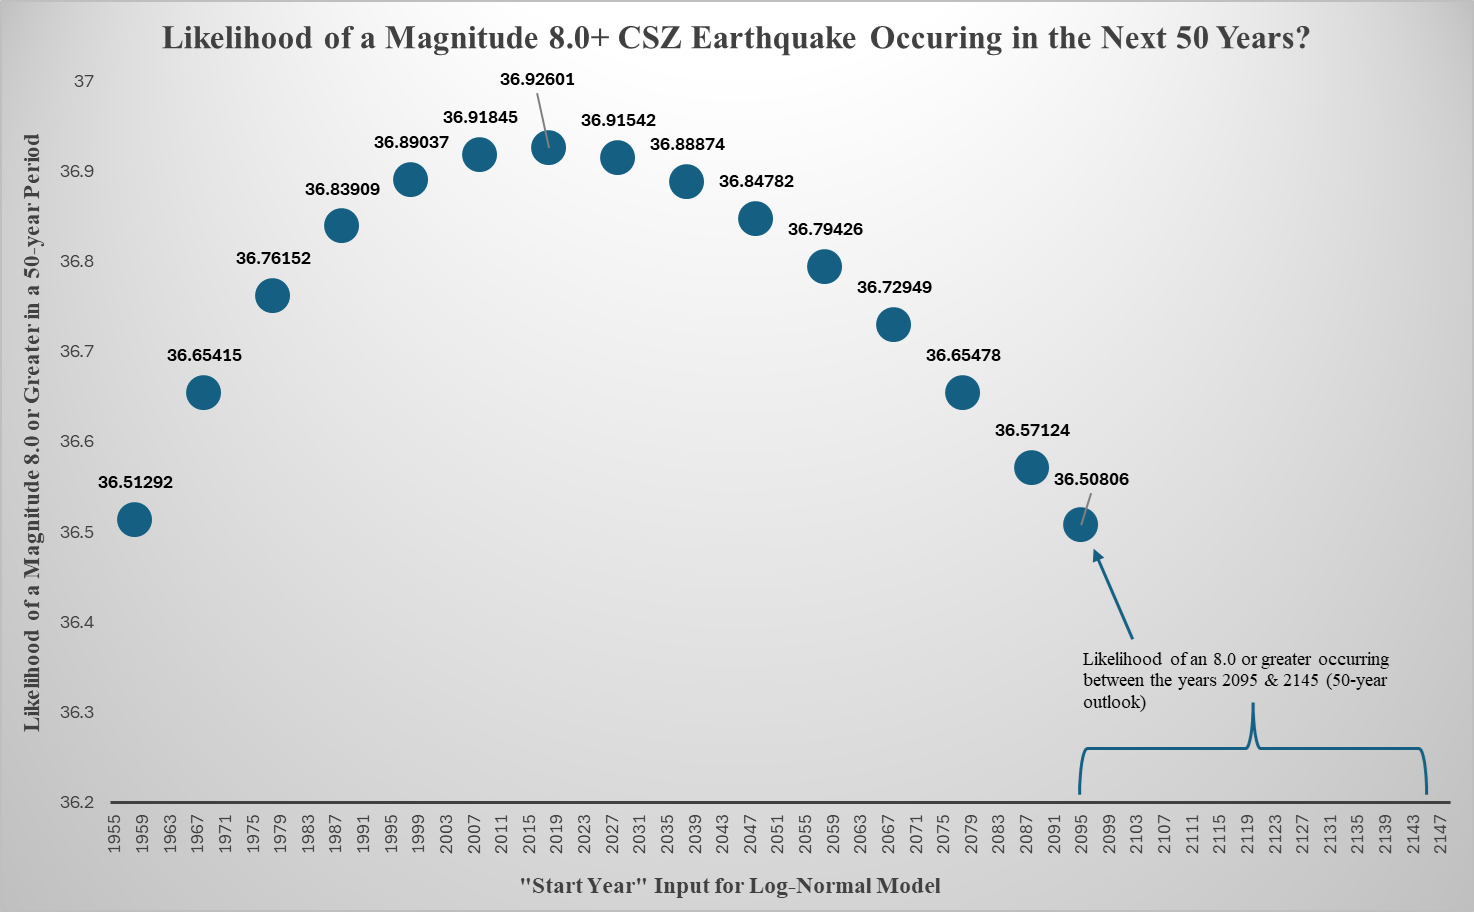
- A scientist using the embedded worksheet above, entering 1958 as the “start year” and 2008 as the “end year”, would have found that the Pacific Northwest had a 36.51% chance of a major earthquake occurring in that timeframe (50-year outlook). That number would have been rounded to show that the region had a 37% chance of an earthquake… In other words, the probability model would have shown essentially the same risk 66 years ago as it does today!
- Using this same model in the year 2095 to determine the likelihood of an event occurring prior to 2145, the model would also provide a risk that rounds up to 37% (36.50806)… Saying there is “a 37% chance it will happen” can be flipped to say “there is a 63% chance it won’t occur by the year 2145”! That’s not very motivating. Seriously, who is going to prepare for an event with that perception in mind?
- According to the model, the probability in 2095 is LOWER THAN the probability was back in 1958. In fact, it shows the risk peeking in the region in 2017—going down every year since.
Unfortunately, the probability of this event occurring doesn’t decrease over time. Pressure will continue to build until the built-up stress ruptures the fault. Here are a couple of visuals showing the three bullet points above.
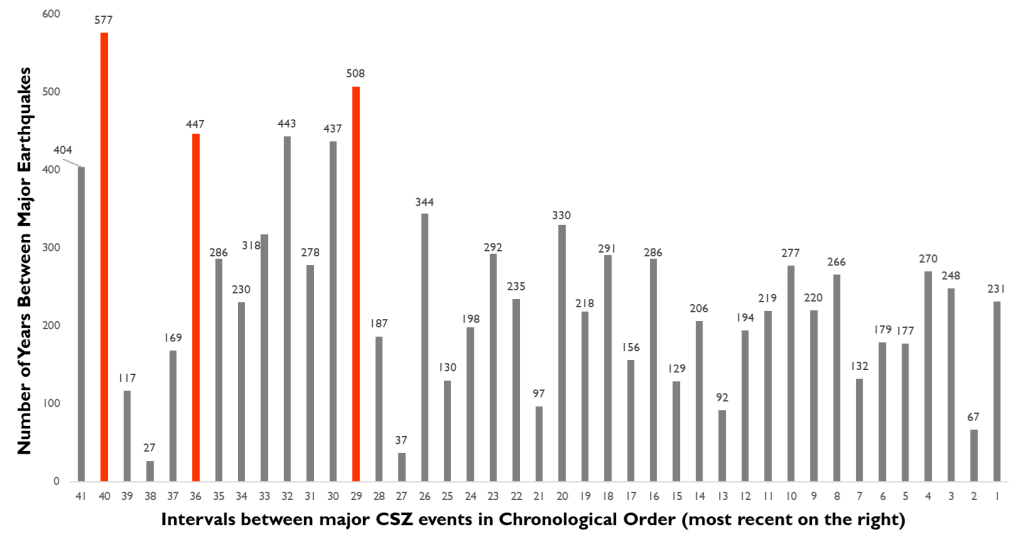
There is a fourth issue to consider with this model. If the region does not have an earthquake by the year 2145, than the Pacific Northwest will have exceeded 38 of the 41 prior intervals between major Cascadia earthquakes.
We will have gone longer than 93% of all other time spans in the past 10,000 years.
As of Today
The longest time span between magnitude 8.0+ Cascadia earthquakes:
- In the past 4 millennia = 291 years… until now
- In the past 6 millennia = 344 years
The region has already gone longer than:
- 81% of intervals during the past 10,000 years
- 93% of intervals during the most recent 6,000 years
So saying there is a “63% chance the earthquake won’t happen by then” may not be the best story to tell ourselves when it comes to risk perception.
For a more in-depth look at this data, visit Surviving Cascadia’s Likelihood on an 8.0 page.
The issues with the current probability model are well known in the scientific community. Northwestern University Professor Seth Stein and his team are currently working on a new probability model.
It has already been used to evaluate risk for the New Madrid Zone and work is underway to apply the model to Cascadia. For more information, visit their research publication, A More Realistic Earthquake Probability Model Using Long-Term Fault Memory, explanatory YouTube video, and PDF with graphics like the one.
We live in a region where these large earthquakes occur. While we don’t know exactly when the earthquake will happen, there is no doubt that the fault is going to rupture at some point. Being 2-Weeks-Ready is the right choice.
Of note, the “37% chance” isn’t the only number out there. Looking at the percentages below—all based on a 50-year outlook—it can feel like the level of risk depends on who you ask. Click the buttons to read the articles.
Check out this Northwestern University paper for more information on why there are so many different probabilities out there. The answers are complex because earthquakes are complex. In this COGS Interview, Professor Goldfinger explains why we hear so many different probabilities. I highly recommend watching the entire interview, as it’s packed with information, but for a brief intro, start the video at 1:02:00.
