“Earthquakes Exemplify nature’s terrifying randomness—and also people’s hubris in pretending that rare,
irregular events can safely be ignored simply because they can not be predicted.”
– Dr. William Cronin, Uncommon Ground
What is the likelihood of a Cascadia Subduction Zone megathrust earthquake? Since 2012, those asking the question have likely found this answer:
“There is a 37% chance of a megathrust earthquake occurring along the
Cascadia Subduction Zone in the next 50 years.”
Many read that quote and flip it— “Well, that’s like saying there is a 63% chance it won’t happen in the next 50 years,” and suddenly, they’re not all that motivated to prepare for Cascadia. It comes down to Risk Perception: someone’s subjective judgment of the likelihood of an event, situation, or outcome. That underlying “63% chance it won’t happen in 50 years” sends a pretty loud perception message.
Worse is the added layer of Optimism bias, defined as the tendency to overestimate the likelihood of positive events and underestimate the likelihood of negative events.
“And even if the whole world should collapse, he will stand fearless among the fallen ruins.”
— Horace (Quintus Horatius Flaccus), Roman poet
But what if the way we, as a society, have been discussing the risk has given a skewed perception of the likelihood? And what if that skewed perception is keeping you and your loved ones from taking steps to be ready?
Nearly 15 years ago, Oregon State University professor emeritus Chris Goldfinger said, “Perhaps more striking than the probability numbers is that we can now say that we have already gone longer without an earthquake than 75 percent of the known times between earthquakes in the last 10,000 years.” Here is where the region is, as of January 26, 2025.
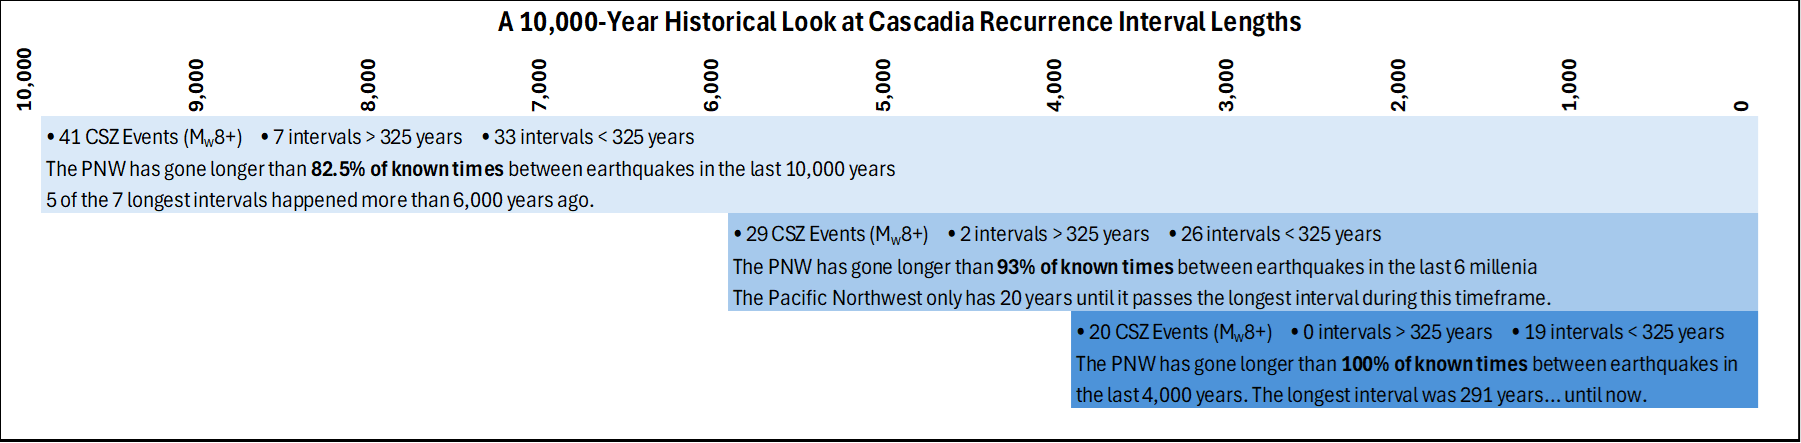
Take a few minutes to travel through this page as it walks you through the data supporting the bullet points above. By the end, you just may find yourself rethinking the likelihood of the next event… and preparing for it.
The probability originates from this 184-page 2012 USGS research publication . Knowing its origin is critical for what comes next.


Let’s think about this publication like a play occurring at a local theatre.
Each fact from the publication is like a prop, setting, or performer. In the years since 2012, a theatre lighting technician has essentially focused the brightest light on a single statistic on page 2—a single fact…
“Time-dependent probabilities are similar for Northern margin events at ~7–12 percent and 37–42 percent in 50 years for the southern margin.”– pg. 2
But single facts don’t always tell the whole story. And they’re usually not meant to. After all, that bright light is just one spot for our eyes to focus. The production—the story—is so much bigger.
Now, let’s say we want to keep the same performance, actors, lines, and setting; in other words, let’s look at the same research publication, the same data, and even the same page.
What happens if the lighting technician moves his spotlight just 1 sentence down?


Wait… By 2060, we will have surpassed 85% of all recurrence intervals?? That seems like a pretty high percentage. But 2060 is 36 years down the road. How many intervals have we already passed? To explore the intervals, we first need to find the estimated ages of the past earthquakes. They are listed in Table 10 on page 97 of the same research paper (shown below on the left). If we plug these dates into Excel (shown below on the right), we can calculate the years between earthquakes, also known as the intervals.

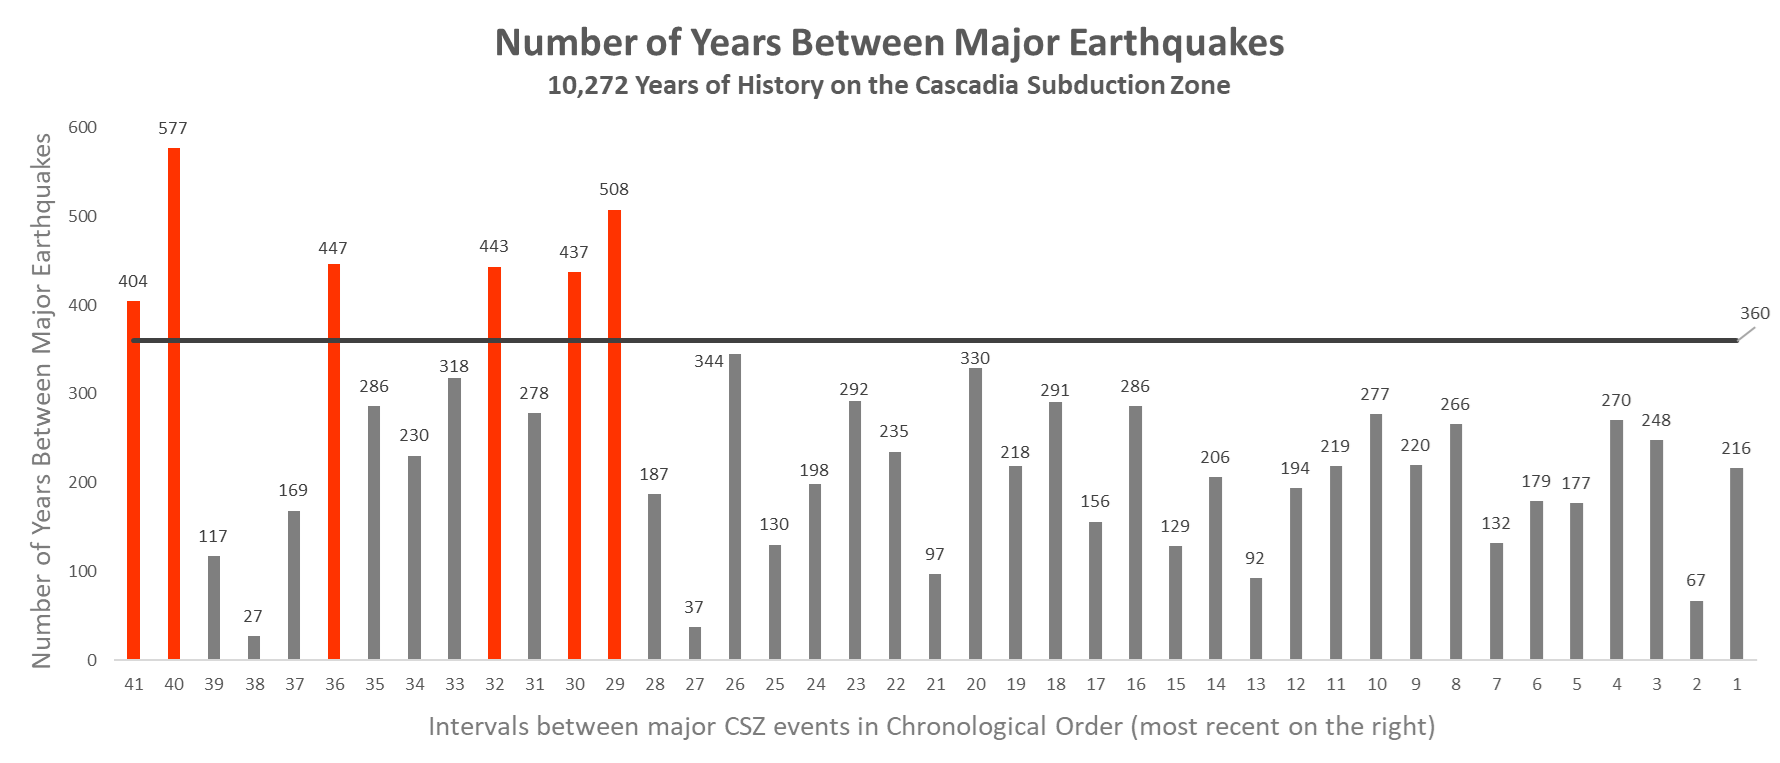
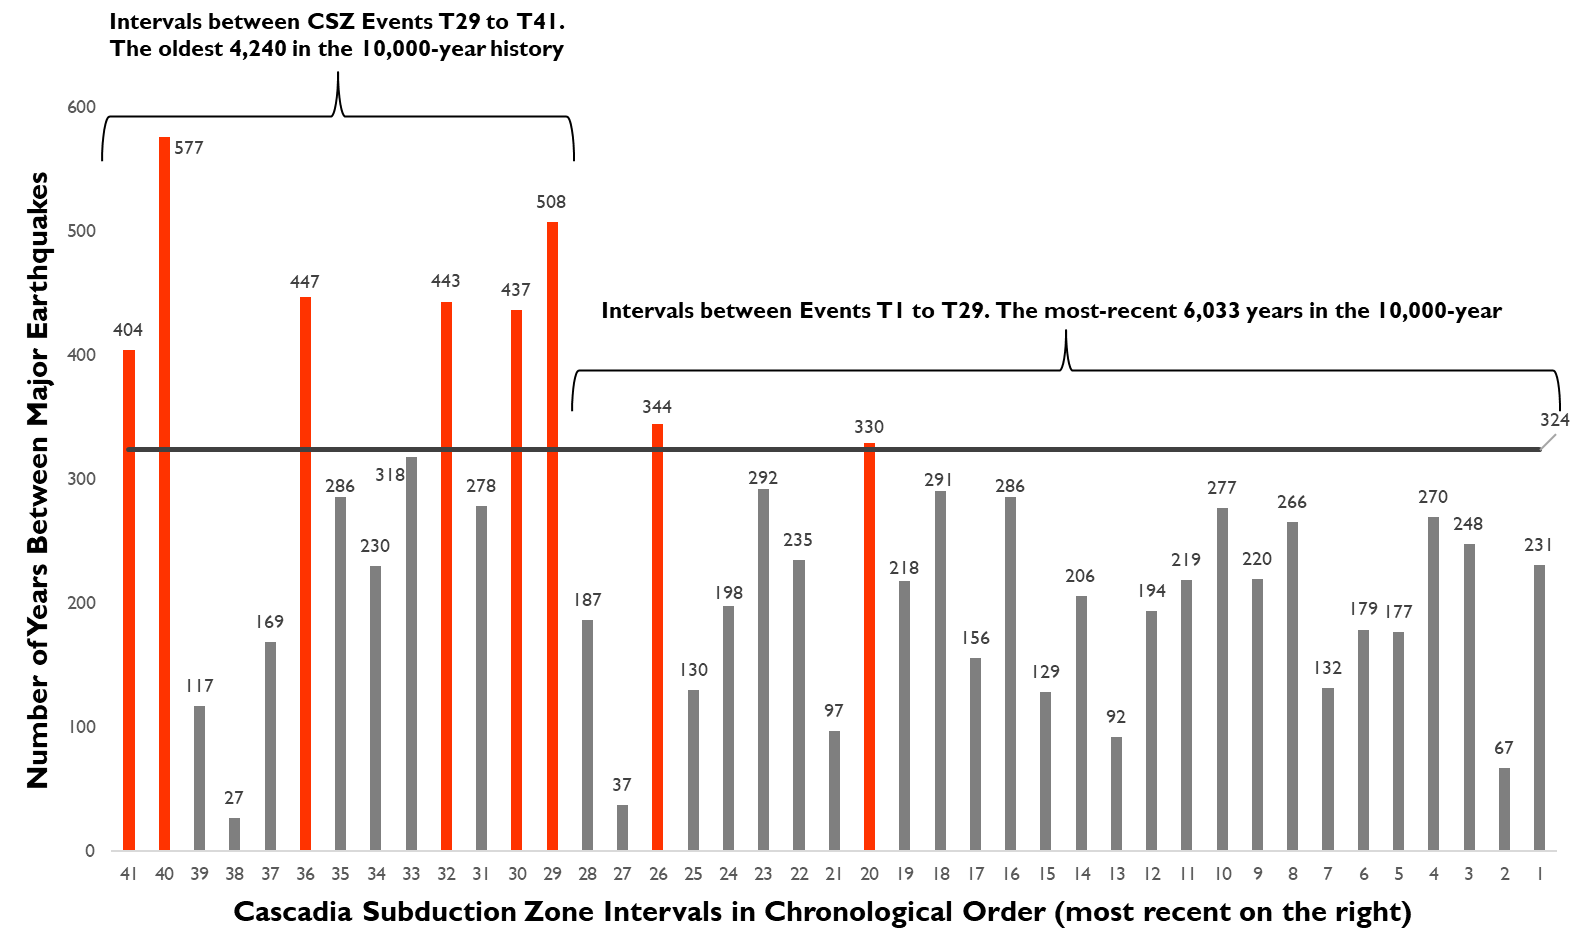
Now comes the fun part!!! Using the intervals calculated above, Microsoft Excel provides the following bar graph.
- Each bar represents the number of years in a single interval.
- The intervals are listed in chronological order with the oldest on the left and the newest on the right.
- The horizontal black line in the graph runs at 360 years — the time that will have passed between the last major CSZ quake in 1700 and 2060 (the year mentioned in the USGS paper)… if an earthquake doesn’t occur by then.
- Intervals over 360 years are shown in red, while shorter ones are in grey.
Only 6 intervals stretch above the black line. So, here’s that quote again. “Failure analysis suggests that by the year 2060, Cascadia will have exceeded… 85 percent of recurrence intervals for the southern margin.”
Okay, but that’s in 2060, which is still 36 years away. What does the current data look like?
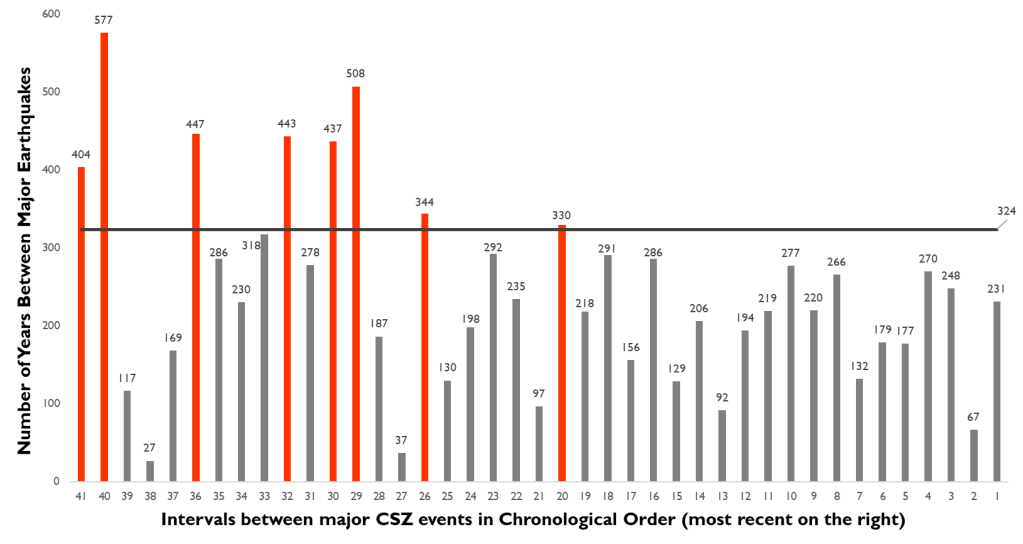
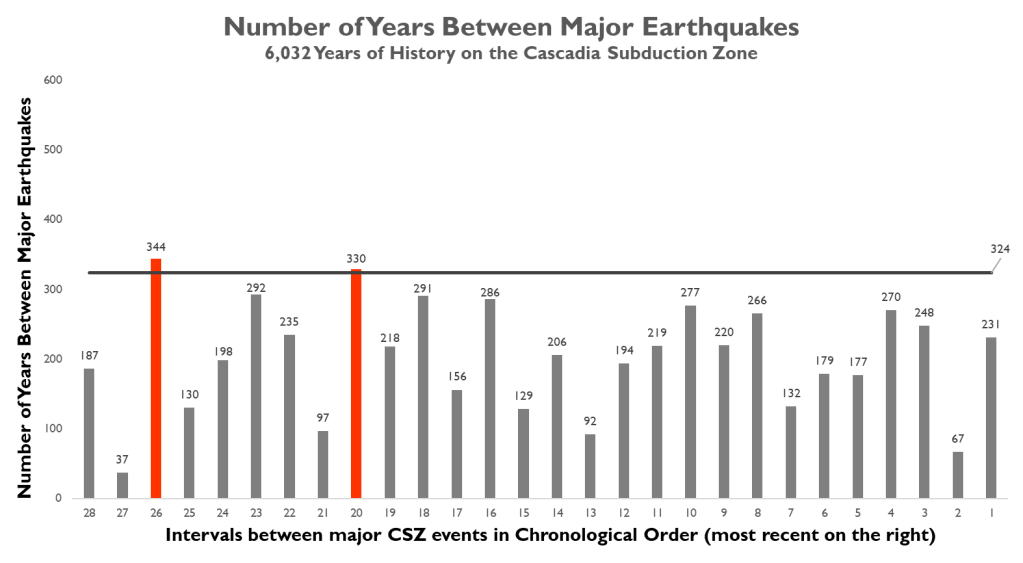
As of January 26th, 2024, the Pacific Northwest has currently gone 324 years without a megathrust earthquake (the last event was on January 26th, 1700).
This bar graph drops the horizontal black line to 324 years, helping to quickly identify past intervals that lasted longer than our current quiescence. As before, intervals longer than 324 years are shown in red.
There still aren’t many.
80% of the time, the fault has not had to wait 324 years for the strain to break it.
80% is quite a bit larger than 37%. And again, the 37% is a 50-year outlook. The 80% figure is as of today!! Moving the spotlight on sentence down makes a difference. Let’s take a closer look at when those longest intervals occurred. They are grouped in the oldest ≈4,000 years of history. Intervals 1 – 28, with the shortest interval averages, encompass the most recent ≈6,000 years.
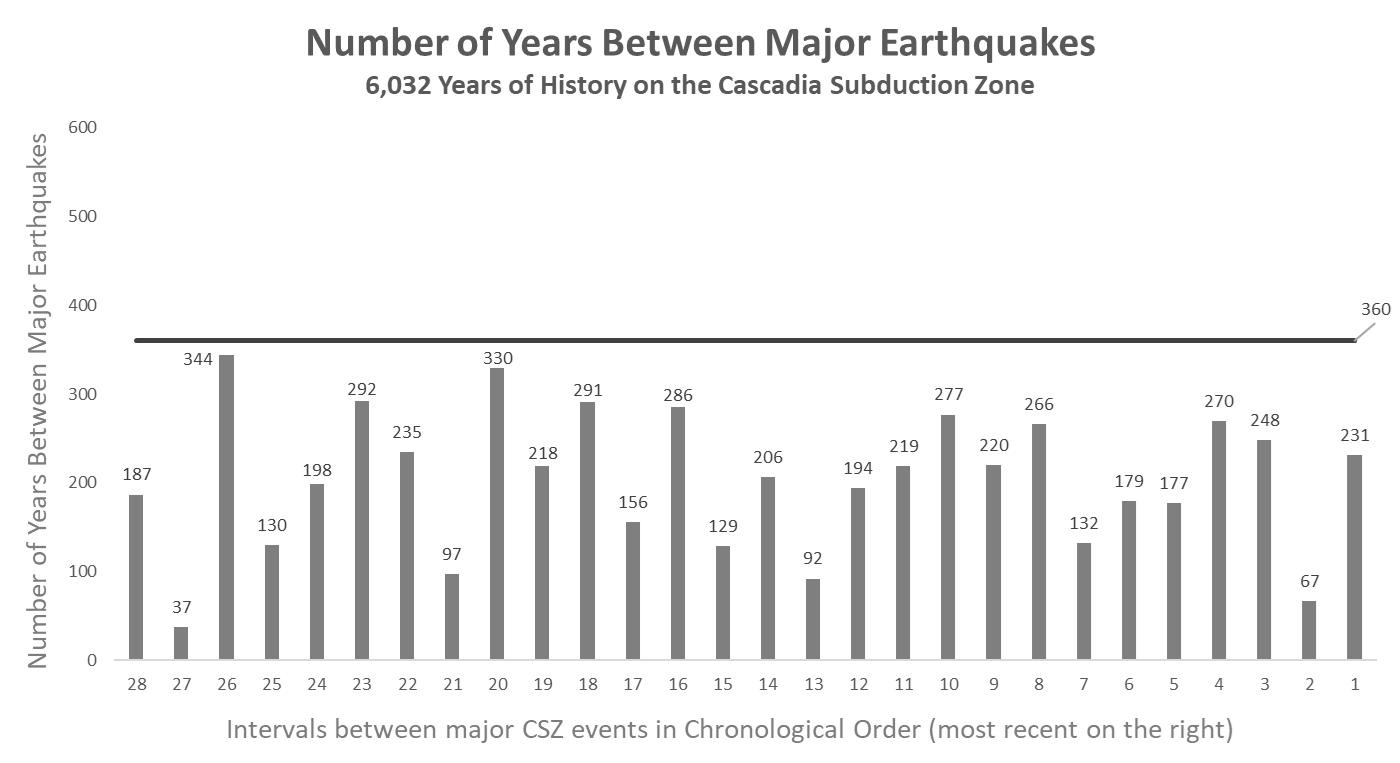
So let’s zoom in on the most recent 6,032 years of CSZ history. Only 2 intervals (shown in red) have been longer than the black line. And those red lines don’t stretch far above! One is 6 years out; the other is only 20.
Again, that black line represents how long the Pacific Northwest has already gone since the last Cascadia megathrust earthquake. So here’s that math…
93% of the time, the fault has not had to wait 324 years for the strain to break it.
The longest span of time between major Cascadia earthquakes in the past 4 millennia was only 291 years… until now.
The Pacific Northwest
Hasn’t had an interval longer than 344 years
In over 6 millennia.
- Looking at the same 6,032 years of data (instead of the full 10,000)
- And projecting out 36 years to the year 2060, as was done in the USGS paper,
…not a single interval reaches that high. The Pacific Northwest only has 21 years until it passes the longest interval during this timeframe. 21 years…
With the two chunks of history behaving so differently, should the oldest 4,000 years be ignored? I don’t think so. The longer the historical record, the better. Using the full 10,000-year history allows us to see that longer intervals are possible and have happened in the past. That said, it’s equally important to recognize that intervals longer than our current amount of time without an event, aren’t the norm or average. In fact, the average number of years between events Looks like this:

And we have reached 324 years.
Understanding that the the next earthquake could still be 200 years off and Expecting the timing of the next earthquake to be way the road… are two very different things. It all comes down to risk perception.
Referencing the 2011 Tōhoku earthquake and tsunami in the OPB documentary Unprepared, Oregon State University Professor Emeritus Chris Goldfinger says:
“Japan is a great example of how an earthquake like this, as bad as it is, is survivable. And to just throw up your hands and say ‘we’re all gonna die’, is wrong.”
We’re not doomed. Nor are we totally safe. Denial isn’t an effective preparedness strategy. A Cascadia Subduction Zone megaquake is a very real threat to our region. It’s critically important to understand the risk of that threat. And to start taking actions to prepare yourself and your loved ones.
