According to the Pacific Northwest Seismic Network (PNSN)’s one-page explanation, “Episodic Tremor and Slip (ETS aka Slow-Slip) is the name given to a process that occurs deep below the Earth’s surface, along faults that form the boundaries of tectonic plates. It involves repeated episodes of slow sliding, one plate over the other, of a few centimeters over a period of several weeks, accompanied by energetic seismic noise, called tremor.”
The terms slow-slip events (SSE), episodic tremor & slip (ETS), and tremors are often used interchangeably.

While slow-slips gently change the land in measurable ways, seen through GPS monitoring, they can’t be felt by us. The change they create is small—just a few centimeters per event—but that movement is thought to transfer stress to the “stuck” part of the fault, shown here in red. Image Credit: USGS
Check out the research below from Oregon State University, Stanford, NIWA, Penn State, and Université Côte d’Azur.

“Slow slip directly triggers seismic slip – we can see that”
-Oregon State University https://today.oregonstate.edu/news/%E2%80%98silent-slip%E2%80%99-along-fault-line-serves-prelude-big-earthquakes-research-suggests

“Every slow slip event adds stress to the adjacent locked megathrust zone bringing it closer to failure.”
Bruhat L., and P. Segall (2016), Coupling on the northern Cascadia subduction zone from geodetic measurements and physics-based models, J. Geophys. Res. Solid Earth, 121, doi:10.1002/2016JB013267.

“Many people think faults with slow-slip events are in a transitional frictional state,” he said. “They are very close to failing (which would cause a typical earthquake), but something is holding back that failure.”
Chakravorty, A. (2020), Getting to the bottom of slow-motion earthquakes, Eos, 101, https://doi.org/10.1029/2020EO143026. Published on 24 April 2020.

“Slow-slip events in Cascadia occur every one to two years, but geologists wonder if one of them will be the one that will trigger the next megathrust earthquake.”
Penn State. “Deep, slow-slip action may direct largest earthquakes and their tsunamis.” ScienceDaily. ScienceDaily, 21 December 2020. www.sciencedaily.com/releases/2020/12/201221173131.htm.

“Both laboratory experiments and dynamic simulations suggest that earthquakes can be preceded by a precursory phase of slow slip.”
Université Côte d’Azur, https://doi.org/10.1038/s41467-020-15494-4

“Using a failure model in which large earthquakes initiate instantaneously at a stress threshold, Mazzotti and Adams (2004) estimated the weekly probability of a great earthquake in Cascadia increases by 30–100 times relative to the probability during the inter-SSE period.”
https://agupubs.onlinelibrary.wiley.com/doi/full/10.1029/2018GL077641#grl57338-bib-0021
“Whereas slow-slip events generally aren’t present before small earthquakes, they often occur in the days before major ones—perhaps detaching “enough of the fault zone that it prepares the system for a big earthquake,” [PNSN Director Harold] Tobin says. “That might end up being something we can use as an earthquake-precursor-detection system.” He’s quick to point out, however, that not all slow-slip events are followed by earthquakes.”
Japan’s New Undersea Earthquake Detection System Will Improve Tsunami Prediction | Scientific American
Japan
“Within months of the 2011 earthquake, the Japanese government began to build S-net (Seafloor Observation Network for Earthquakes and Tsunamis). S-net wired the nation’s earthquake-detection network to the Japan Trench, the seismologically active offshore region where the 2011 earthquake began. Roughly 3,540 miles of cable now zigzag across 116,000 square miles of ocean to connect 150 observatories on the ocean floor. Each contains 14 distinct sensing channels, including seismometers and accelerometers, as well as pressure gauges to measure waves passing overhead.”
United States
“In stark contrast to Japan, the Cascadia megathrust fault has only a single cable with three seismometers, though funding was recently secured to replace one of the seismometers and to add three more. (Canada also has a small cable system in place.)”
Fortunately, devastating subduction zone earthquakes don’t happen often (on human timescales), but that infrequency makes them difficult to study. However, there have been a few which have occurred since the discovery of these slow slip events. Check out this research from Tohoku University, the National Institute of Health, and the European Global Ocean Observing System.
The research paper, Episodic slow slip events in the Japan subduction zone before the 2011 Tohoku-Oki earthquake, provides details of a slow slip event that began in February 2011, lasted a month, and triggered the foreshock Mw 7.3 (March 9, 2011) that triggered the Mw 9.0–9.1 2011 Tohoku-Oki earthquake.


“A recent major study from their seismologists correlated every large earthquake to a slow-slip event that was happening at the time — including the 2011 Tohoku earthquake.”
Uchida, Naoki & Iinuma, Takeshi & Nadeau, Robert & Burgmann, Roland & Hino, Ryota. (2016). Periodic slow slip triggers megathrust zone earthquakes in northeastern Japan. Science. 351. 488-492. 10.1126/science.aad3108.
“The find reveals how the lethal offshore fault slipped slowly just before it ripped loose. That slow slip now appears to have loaded the fault to the breaking point, triggering the devastating quake last March.”
Kerr, Richard. (2012). A Tantalizing View of What Set Off Japan’s Killer Quake. Science (New York, N.Y.). 335. 272. 10.1126/science.335.6066.272.


“Researchers have shown that the magnitude 7.3 quake that struck Papanoa on 18 April 2014 was caused by a slow slip event that had begun two months earlier.”
Triggering of the 2014 Mw7.3 Papanoa earthquake by a slow slip event in Guerrero, Mexico. Nature Geoscience. 9. 10.1038/NGEO2817.
The Mw 8.1 Iquique earthquake in Chile that occurred on April 1st 2014, is discussed in the research paper, Intense foreshocks and a slow slip event preceded the 2014 Iquique Mw 8.1 earthquake.

As the research above shows, some slow slip events wind up being the straw that breaks the camel’s back. But most slow-slips occur without a major earthquake following suit. Some “smaller” earthquakes wind up being foreshocks. Some don’t. These aren’t predictors. At least not yet.
So when should scientists warn the public of a potential megathrust earthquake? Harold Tobin, Director of the Pacific Northwest Seismic Network (PNSN) and professor at the University of Washington is interviewed on the subject in the following article, Earthquake scientists are learning warning signs of the ‘big one.’ When should they tell the public?. The article is worth a read, as it discusses some of the ambiguities, progress that needs to made in monitoring around Cascadia, and the quandry of deciding when to issue an alert.
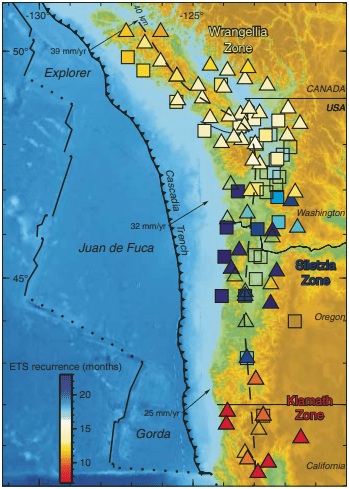
Broken into three primary regions—Northern (Wrangellia Zone), Central (Siletzia Zone), and Southern (Klamath Zone) — slow-slips can be viewed through the University of Washington’s Pacific Northwest Seismic Network Tremor Map. Visit the three pages below for screen snips that I’ve captured for the events by segment.
Northern (Wrangellia Zone)
To see dates and screen snips of the Northern (Wrangellia Zone) Slow-Slip events from 2010 – June of 2025, visit Surviving Cascadia’s Northern ETS Patterns page.
Central (Siletzia Zone)
To see dates and screen snips of the Northern (Wrangellia Zone) Slow-Slip events from 2010, visit Surviving Cascadia’s Central ETS Patterns page.
Southern (Klamath Zone)
To see dates and screen snips of the Southern (Klamath Zone) Slow-Slip events from 2010-2024, visit Surviving Cascadia’s Southern ETS Patterns page.
Image Credit: 2007 Miami University and UC Berkeley research
Slow-slip events are made up of thousands of tiny, measurable (usually magnitude 0.8-2.4 range) earthquakes occurring close in space and time over the span of weeks. The question comes—do all those small earthquakes relieve stress on the fault? According to the Government of Canada, smaller earthquakes are unlikely to lower the risk level, and as explained by many sources above, these events are shown to actually increase the stress on a fault instead. Here is a question and answer copied from their earthquake Q&A page.
If we have lots of little earthquakes, will they relieve the stress building up for a megathrust earthquake?
No. It takes many, many small earthquakes to release the amount of energy equivalent to a large earthquake. The amount of energy released increases about 40 times every time there is an increase of one unit on the magnitude scale. Thus, if we consider a small earthquake at the felt level, about magnitude 2, there would have to be 40x40x40x40x40x40x40 of these earthquakes to release the amount of energy as one magnitude 9 event. That is about one million small earthquakes a day, every day, for 500 years. That level of earthquake activity is not observed.
As an aside, if you are curious about how larger earthquakes might affect the fault, visit Offshore Non-Cascadia Earthquakes – Surviving Cascadia and read the section on the 2021 offshore swarm.

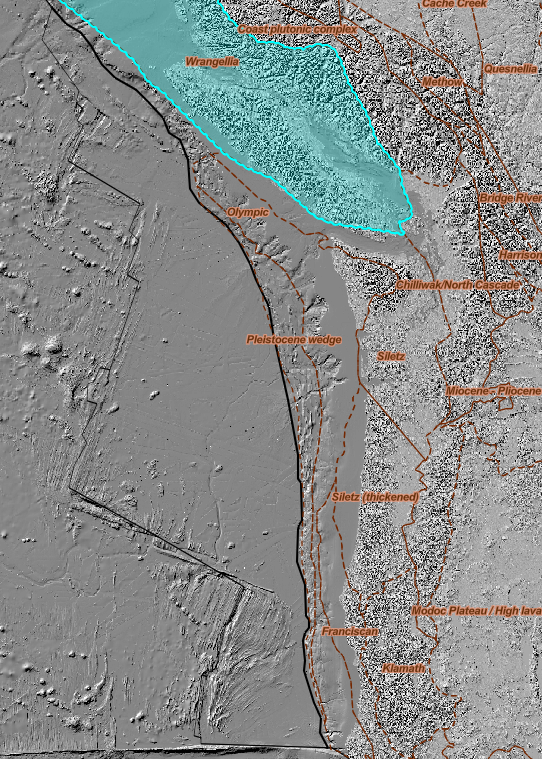
One last fun fact: It’s worth noting that the Northern (Wrangellia Zone), Central (Siletzia Zone), and Southern (Klamath Zone) regions above have names that relate to the terrane in which the activity occurs. They can be seen in the slideshow below. The screen snips come from the USGS Cascadia Subduction Zone GIS Story Map. A direct link to the map (rather than the story map in its entirety) can be found here.