What is the likelihood of a Cascadia Subduction Zone full-margin rupture, also known as a full-rip or magnitude 9.0?
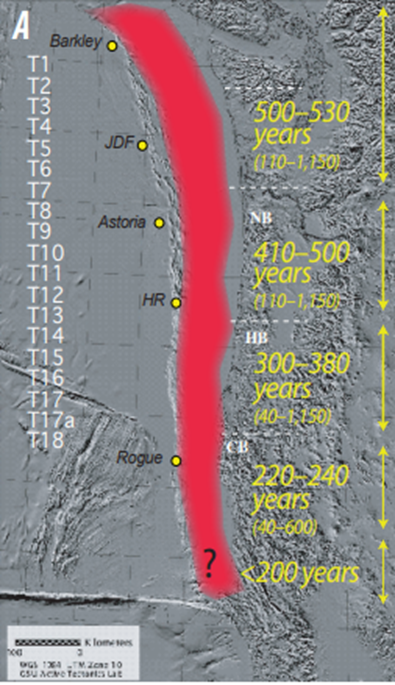
Over the past 10,000 years, roughly half of the 43 CSZ megathrust earthquakes have been full ruptures. 19 are shown in Segment A. The white lettering on the left side of this image lists the turbidity (T) event names given to the earthquakes. The red shows the distance that the rupture traveled.
(Note that T19, not shown here, takes the number of full ruptures to 20 M9 events in 10,271 years. T19 will be shown in some of the data below.)
There is also some debate as to whether the 3 earthquakes shown in Segment B below were full-margin ruptures. More on that in a minute.

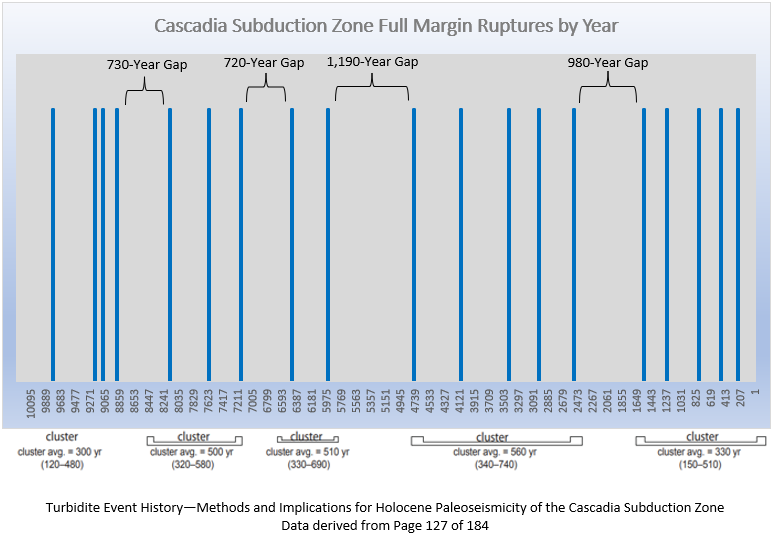
Check out this USGS graph from their paper, Turbidite Event History—Methods and Implications for
Holocene Paleoseismicity of the Cascadia Subduction Zone. It illustrates how M9s appear to cluster on the CSZ. The most recent grouping shows average intervals of only 330 years… between M9s! (We have currently gone 323 years as of 2023.)

Here are two quotes that put into perspective why this matters.
“We’re just starting to understand the whole idea of clusters, and there isn’t consensus on whether we are in one or not, but that possibility does exist, which further suggests that we may experience a major earthquake sooner than later.”
Odds are 1-in-3 that a huge quake will hit Northwest in next 50 years
”Results indicate that 13 catalogs exhibit statistically significant clustering behavior, yielding a probability of clustering of 13/20 or 0.65. Most (70%) of the 20 catalogs contain two or three closed clusters (a sequence that contains the same or nearly the same number of events) and the current cluster T1–T5 appears consistently in all catalogs. Analysis of the 13 catalogs that manifest clustering indicates that the probability that at least one more event will occur in the current cluster is 0.82.”
Ram Kulkarni, Ivan Wong, Judith Zachariasen, Chris Goldfinger, Martin Lawrence; Statistical Analyses of Great Earthquake Recurrence along the Cascadia Subduction Zone. Bulletin of the Seismological Society of America 2013;; 103 (6): 3205–3221. doi: https://doi.org/10.1785/0120120105

As with the other pages on this website, I do my best to show where information is coming from. The data that supports the chart above comes from page 127 of the same USGS paper, and I’ve broken it down into this table on the left. The green intervals are spans of time between one full-rip and the next, where fewer than 323 years lapsed.
The 323-year interval at T0 represents how long we have gone without a megathrust CSZ earthquake. It is not listed to imply that the next rupture will be a full-rip. The row was added here for comparison purposes only.
Here’s a quick look at how the intervals compare over time. Note that the intervals have been shorter on average during the most recent 1,500 years.
But here’s where things get a bit more complicated. Remember when I said we’d get back to the 3 earthquakes in Segment B? This is that moment. The data above is taken from 2012 research. In 2017, new core samples found that three earthquakes already on record (T5b, T10b, and T10f) had been larger than previously thought… and could potentially be considered full ruptures.

Recreating the USGS chart from above in Excel (and even copying the cluster diagram across the bottom for consistency), let’s look at how the chart changes with respect to the clustering behavior when the three earthquakes are added. The image on the left shows the 2012 data, while the image on the right shows the 2017 additions.
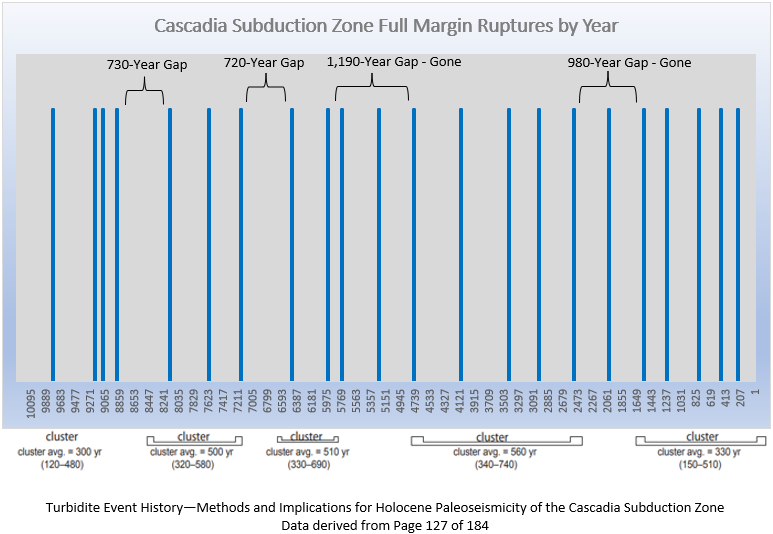

Rerunning the intervals from above with 2017 data shows a decrease in the longest intervals. 2012 showed the longest interval between magnitude 9 earthquakes (not counting the M8s that fell between) at nearly 1,200 years. 2017 data has the longest interval reaching 733. It’s a big difference and, IMHO affects how we, as a society, need to evaluate risk… if the three are full ruptures.
Page 129 (141/184) of the 2012 USGS publication, Turbidite Event History—Methods and Implications for Holocene Paleoseismicity of the Cascadia Subduction Zone, lists the following:

In 2016, updated research published through Oregon State University increased the probabilities for the 2 northernmost sections of the fault. Here’s how the numbers changed.

The average number of years between CSZ megathrust earthquakes (not just 9.0s) is 223. We have currently gone 323 years without one. So let’s move to a follow-up question.
Do all long intervals (of, say, 323 years or more)
between major CSZ earthquakes result in full-rips?
Since pressure in the fault builds up over time, theoretically, the more time that passes without a rupture, the greater the stress on the fault. History shows us only 8 of the past 46 intervals between major CSZ earthquakes were longer than 323 years. On two occasions, those longer intervals preceded partial-rip earthquakes (8.0-8.9). Here are the two.
T10c (Segment C): Preceded by a 344-year interval
T15a (Segment D): Preceded by a 447-year interval

The other six intervals were followed by full-rips. So…
3/4th of the time, intervals longer than 323 years resulted in FULL-RIPS. Ouch! Regardless of whether it will be an M8 or M9, the effects will devastate the region. Take this opportunity to take the City of Salem’s 2-Week-Challenge or Washington’s Prepare In A Year Challenge so you’ll be ready when it comes.
In a recent social media post, Professor Goldfinger provided the following information and image. He also provided a link to the 2023 publication, A More Realistic Earthquake Probability Model Using Long-Term Fault Memory. The research comes from Professor Seth Stein and his colleagues at Northwestern University. I highly recommend reading it!!
Further discussion on the topic from the experts can be found on Facebook’s Pacific Northwest Earthquake Discussion Group’s post. This comment and the images below are of particular interest.
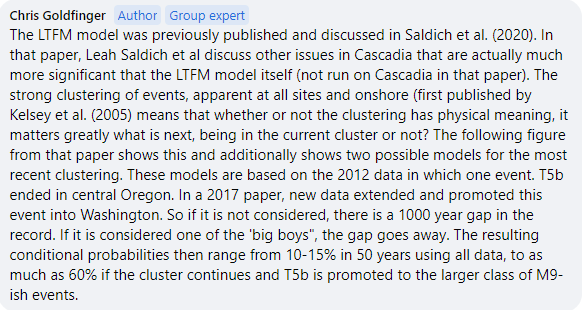

In 2012 data where the clustering is evident, the risk of a major earthquake is much higher if, in fact, the PNW is in a cluster (rather than the space between). 2017 data mostly eliminated the clustering, and so the risk of being in one doesn’t skew the risk as much in the models.
I asked a follow-up question and am posting his reply below. It helped me understand how complex the situation is.

It’s worth noting that whether the three earthquakes are classified as “Big Ones” doesn’t have an impact on the relatively short intervals that have been occurring in the most recent 1,500 years, shown in the purple box below where three of the most recent 4 intervals were shorter than our current stretch. Just food for thought.

Click here to return to the top of the page.
