Northern (Wrangellia Zone) Slow-Slip events: 2010-2023
*The terms slow-slip events (SSE), episodic tremor & slip (ETS), and tremors are often used interchangeably.*
This page consists of screen snips from the Pacific Northwest Seismic Network’s (PNSN) Tremor Map.
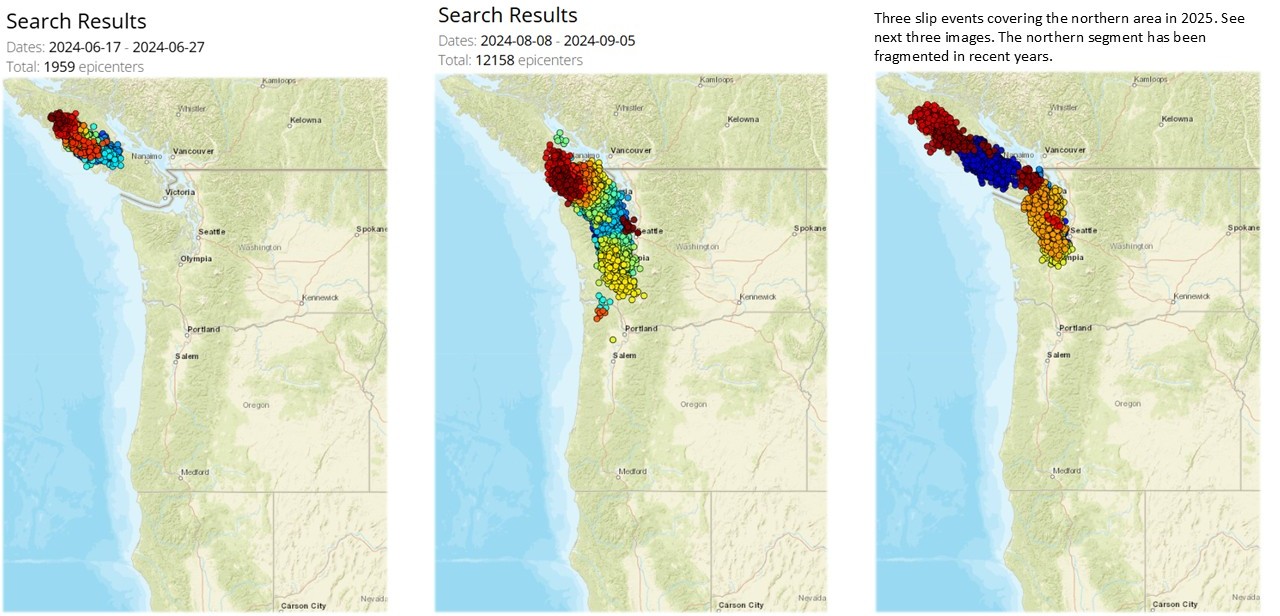
 This page aims to allow readers to easily view Episodic Tremor & Slip events (slow-slips) side-by-side.
The slideshow, which comes first, displays three slow-slip events per page. The tremor activity is displayed in the PNSN’s “Color by Time (Jet)” option, where red is the most recent activity and blue is the oldest. This option helps illustrate how the tremor moved (migrated) from start to finish (sometimes reversing course and backtracking).
Note: A “geographic filter” was also used when compiling these images so that only the slow-slip (ETS) activity is shown on each image. This was done to (hopefully) make the slip area easier to compare from event to event.

Below are screen snips of the PNSN tremor graphs showing daily “epicenter count” activity. The dates selected below coincide with the slow-slips from the slideshow above. The dates listed in the captions are hyperlinks and will take you to the PNSN’s Tremor Map with the parameters already populated for that event. This is done, to help ensure the data is easily reproducible/verifiable for anyone interested in playing with the maps.
2010

11.282 epicenters
2011

9,157 epicenters
2012

14,371 epicenters
2013

8,865 epicenters
2014

7,669 epicenters
2015-2016

7,329 epicenters
2017: Northern events become fragmented

3,084 epicenters

7,261 epicenters
2018

2,604 epicenters

8,788 epicenters
2019

3,904 epicenters

2,690 epicenters

4,969 epicenters
2020

8,277 epicenters
2021

5,584 epicenters

7,876 epicenters
2022

5,939 epicenters

2,807 epicenters

928 epicenters
2022-2023 (as of 5/25/2023)

1,923 epicenters

9,111 epicenters