

According to the United States Geological Survey (USGS), large earthquakes occasionally trigger volcanic eruptions… if the volcano is already poised to erupt.
During a January 26, 2021 presentation at the Central Oregon Geoscience Society, The Next Great Cascadia Earthquake – How did we get here? OSU Professor Emeritus Chris Goldfinger explained that roughly 20% of the time, volcanoes along the Cascade Mountain range have erupted within a reasonably short timeframe (days to months) after a Cascadia megathrust earthquake (jump to the 58-minute mark & the 1-hour 20-minute mark). This phenomenon has been observed in other locations around the world, such as Chile, Sumatra, and Japan where large subduction zone earthquakes also occur.
Image: Indonesia’s Mount Ruang volcano, 4/17/2024, Center for Volcanology and Geological Hazard Mitigation/AFP/Getty Images
“Based upon eruption history and distance to population centers, a 2018 volcanic threat assessment designated nine volcanoes in Washington and Oregon with a “high” or “very high” rating. Very High Threat: Crater Lake, Glacier Peak, Mount Baker, Mount Hood, Mount Rainier, Mount St. Helens, Newberry, Three Sisters. HIGH: Mount Adams.
Download the 2018 update to the U.S. Geological Survey national volcanic threat assessment.” – USGS
In some cases, volcanic eruptions can also trigger an eruption at a nearby volcano… if they share a common reservoir. A new study, Segmentation and Radial Anisotropy of the Deep Crustal Magmatic System Beneath the Cascades Arc, led by researchers at the Australian National University, published March 2023, revealed “two distinct arc parallel magma reservoirs in the mid-lower crust, one connecting Mt. Rainier to Mt. Adams (MA) and another connecting Mt. St. Helens to Mt. Hood”.
Image Credit: USGS

Cascadia megathrust earthquakes and Cascade volcanic eruptions are both effected by the same system. To better understand what is happening beneath the surface, check out this simplified video clip from the Pacific Northwest Seismic Network’s (PNSN) page on plate tectonics.
So what volcanoes make up the Cascade Mountain Range? When have those volcanoes erupted in the past? How large were the eruptions?
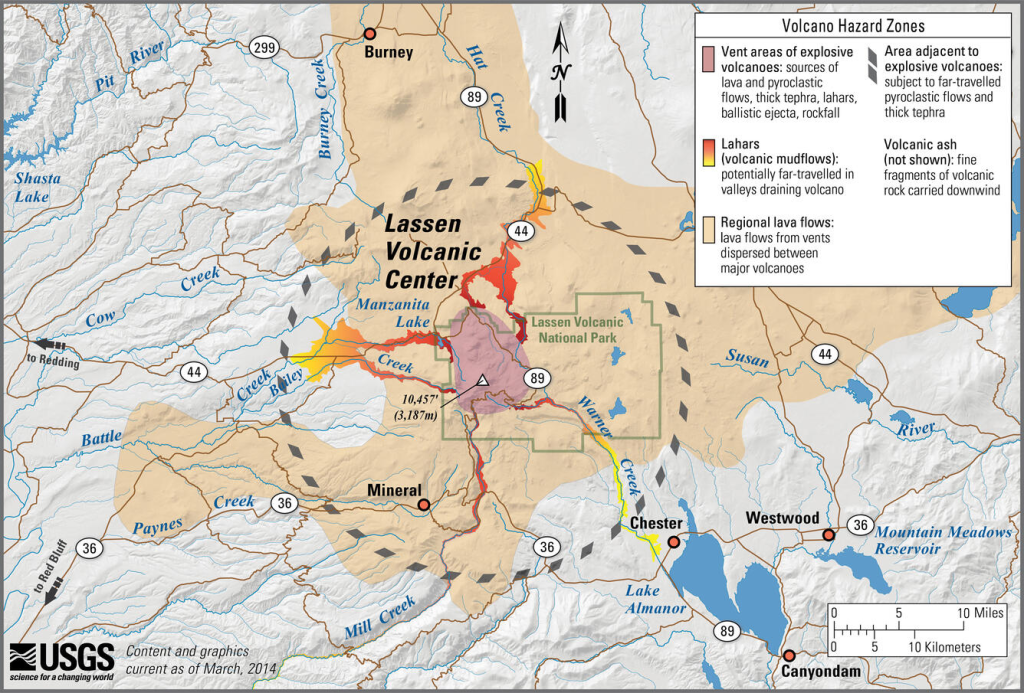
Scroll down to view images, quick facts, and estimated eruption dates (Holocene) for each of the volcanoes shown in this image from the National Park Service.
The list below starts with the volcanoes in the north and takes you on a trip south as you scroll down. The information for each comes from the Smithsonian Institution National Museum of Natural History Global Volcanism Program.


Photo by Lee Siebert, 1987 (Smithsonian Institution)

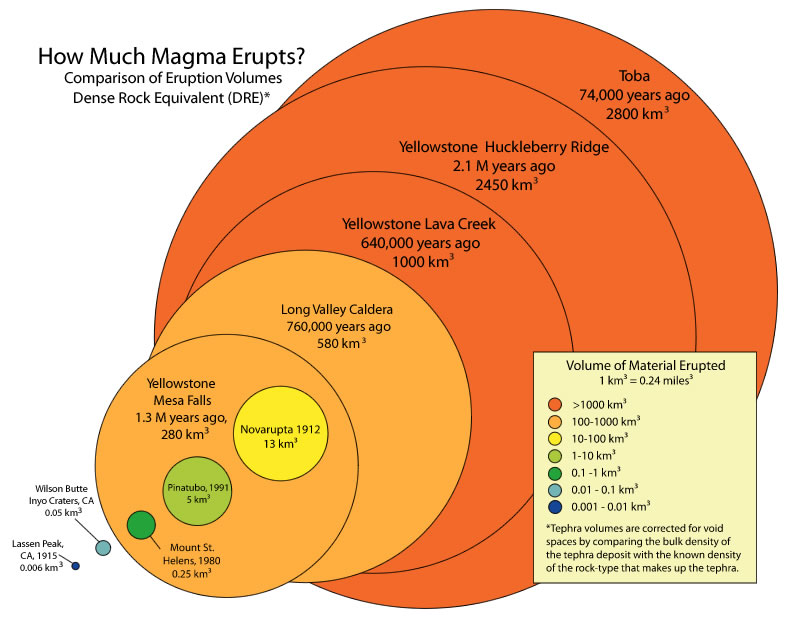
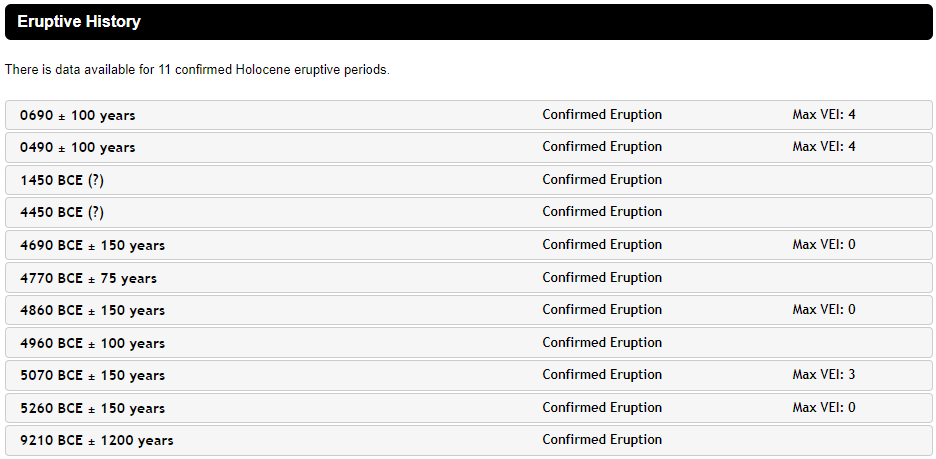
The Volcanic Explosivity Index (VEI) listed to the right of the confirmed eruption above (Max VEI: 5) is a bit like magnitudes on the Richter Scale for earthquakes, categories of hurricanes on the Saffir-Simpson scale, or ratings of a tornado on the Enhanced Fujita Scale. Not every eruption on this page has a VEI assigned to it. Of those that do, the majority have a VEI of 2 or 3, so it’s important to recognize that not all eruptions will be as strong as (or stronger than) the 1980 St. Helen’s eruption.
“[Supervolcanoes] are described qualitatively as Apocalyptic. Each value on the VEI has a qualitative description ranging from Effusive (VEI 0) to Apocalyptic (VEI 8).”


Photo by Lee Siebert, 1983 (Smithsonian Institution)


Photo by Lee Siebert, 1973 (Smithsonian Institution)
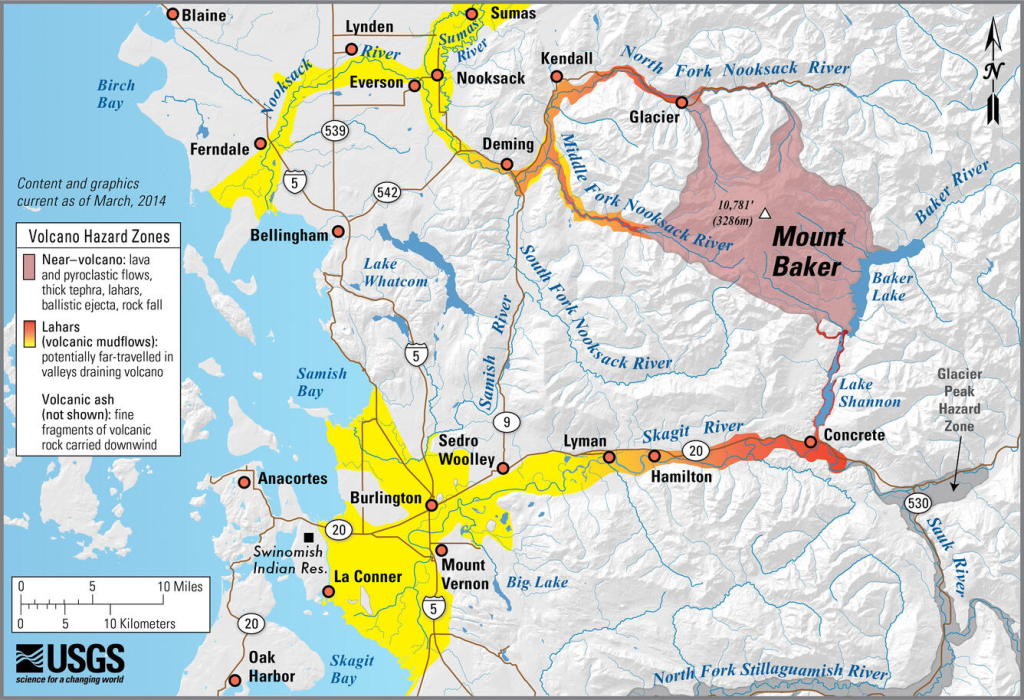


Photo by Lee Siebert, 1971 (Smithsonian Institution)
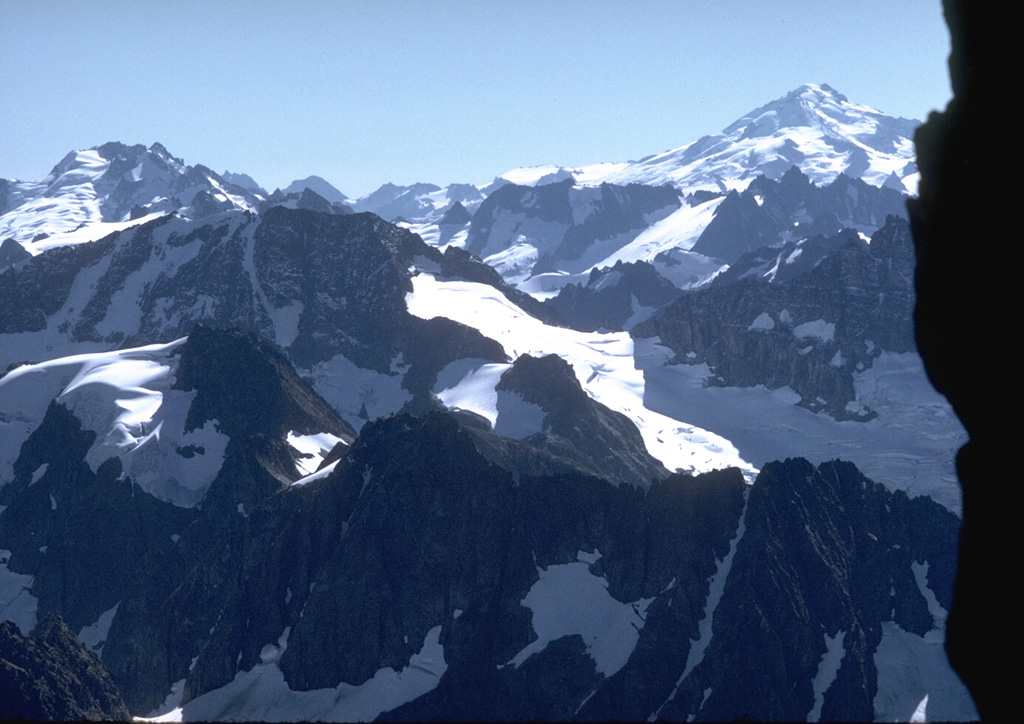

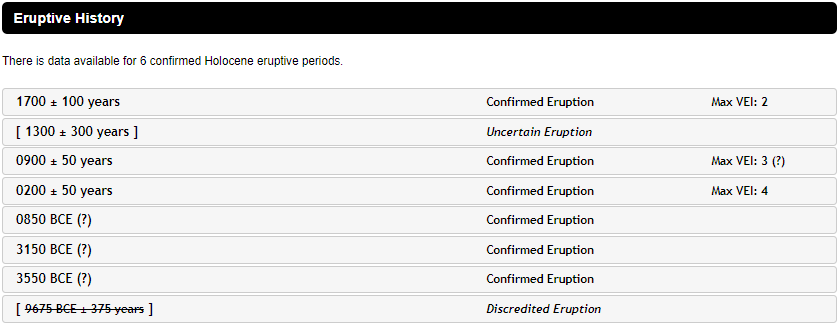


Photo by Lee Siebert, 1972 (Smithsonian Institution)


Photo by Lee Siebert, 1981 (Smithsonian Institution)


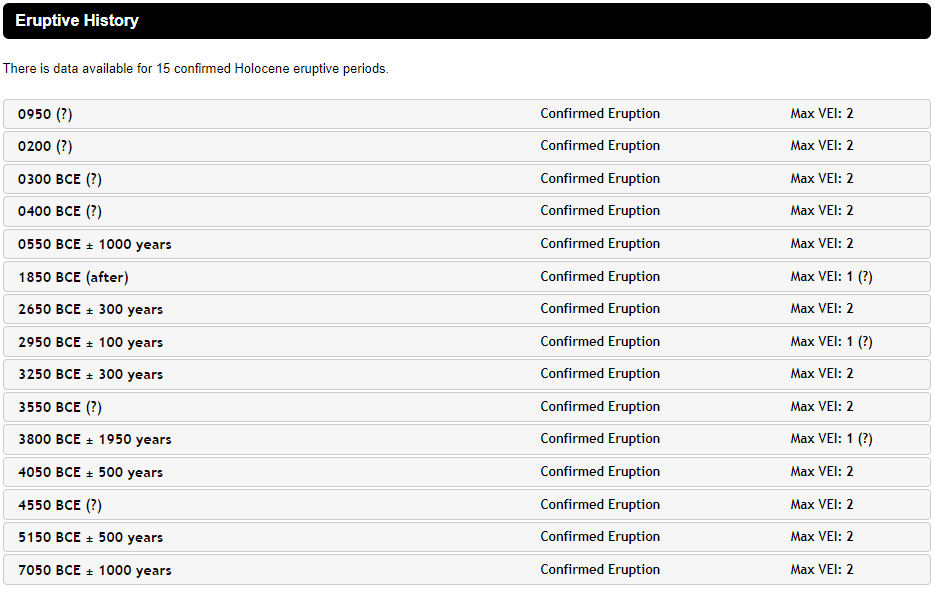


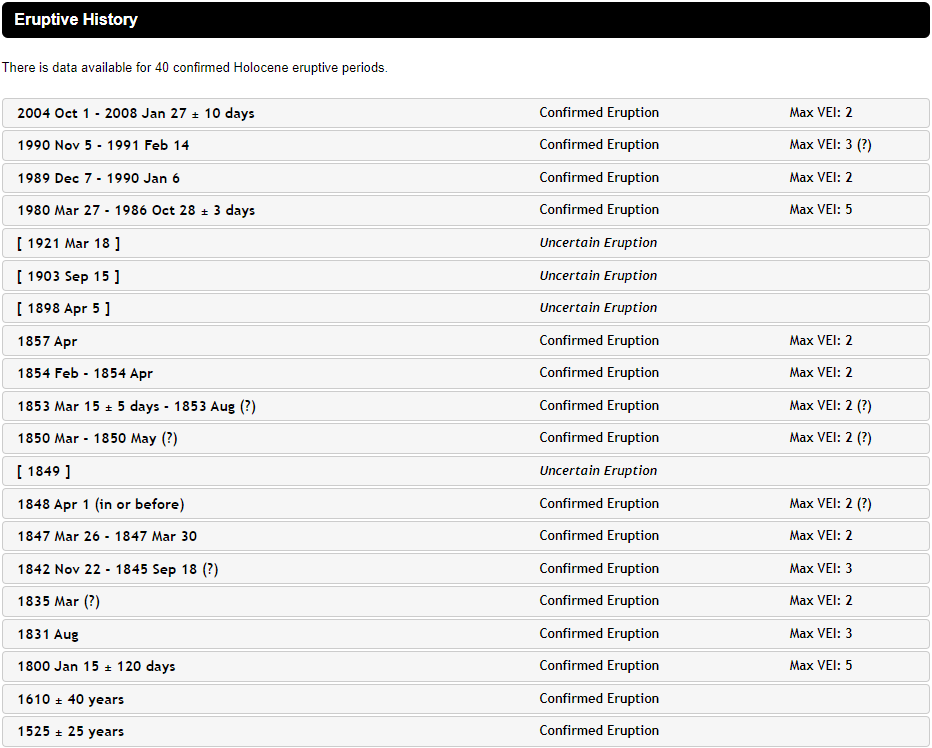
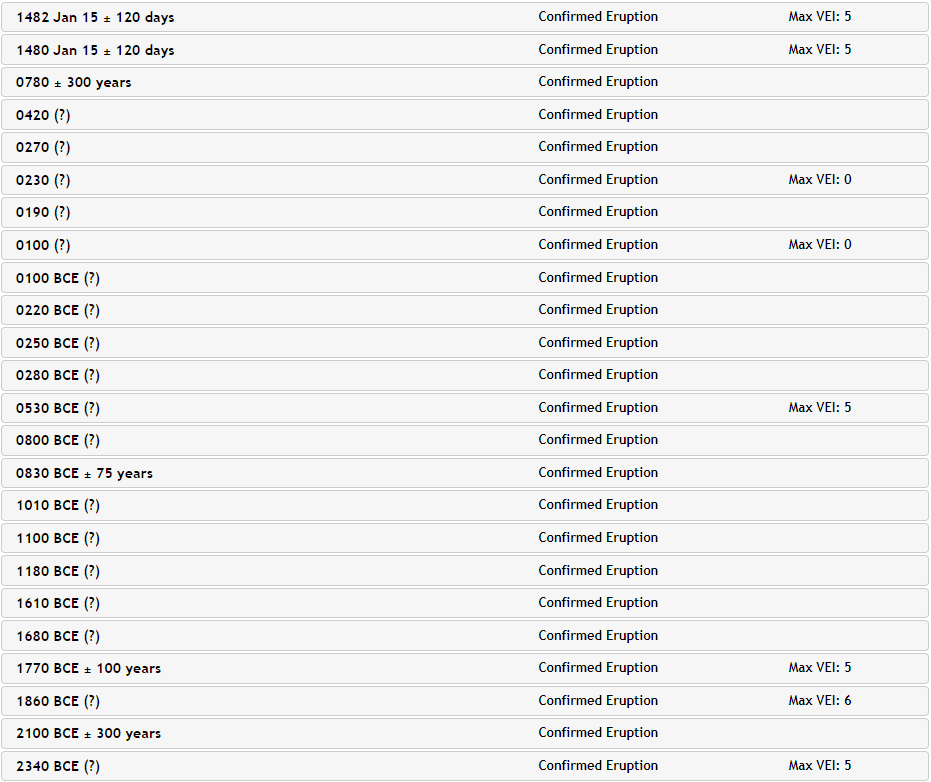

Photo by Richard Fiske (Smithsonian Institution).


Photo by Lee Siebert, 1995 (Smithsonian Institution)


Photo by Lee Siebert, 1982 (Smithsonian Institution)
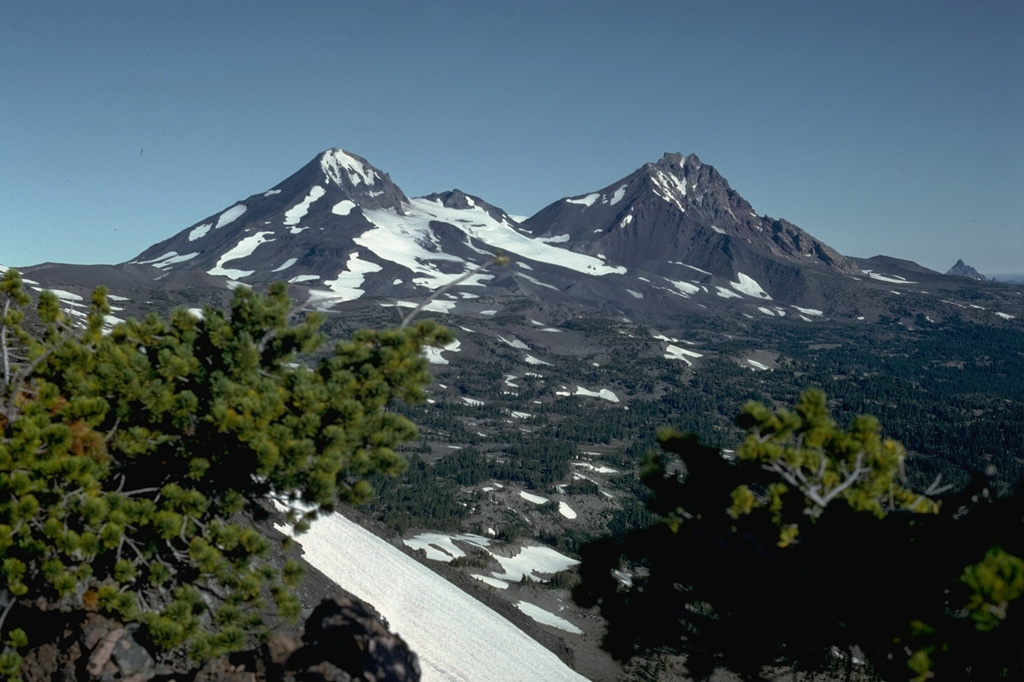


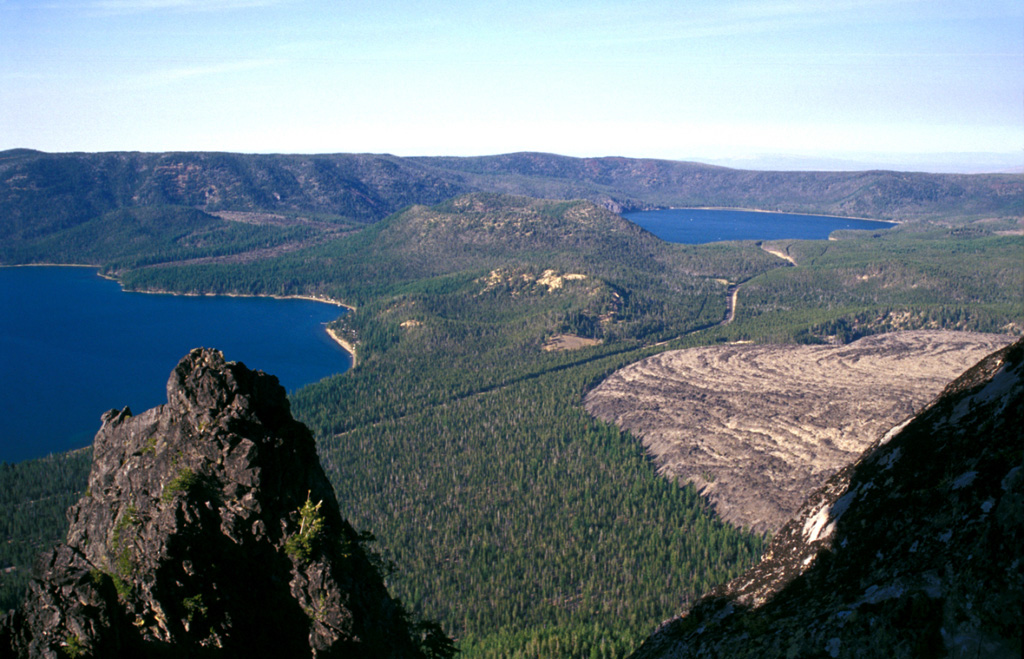
Photo by Lee Siebert, 2002 (Smithsonian Institution)

Copyrighted photo by Katia and Maurice Krafft, 1984
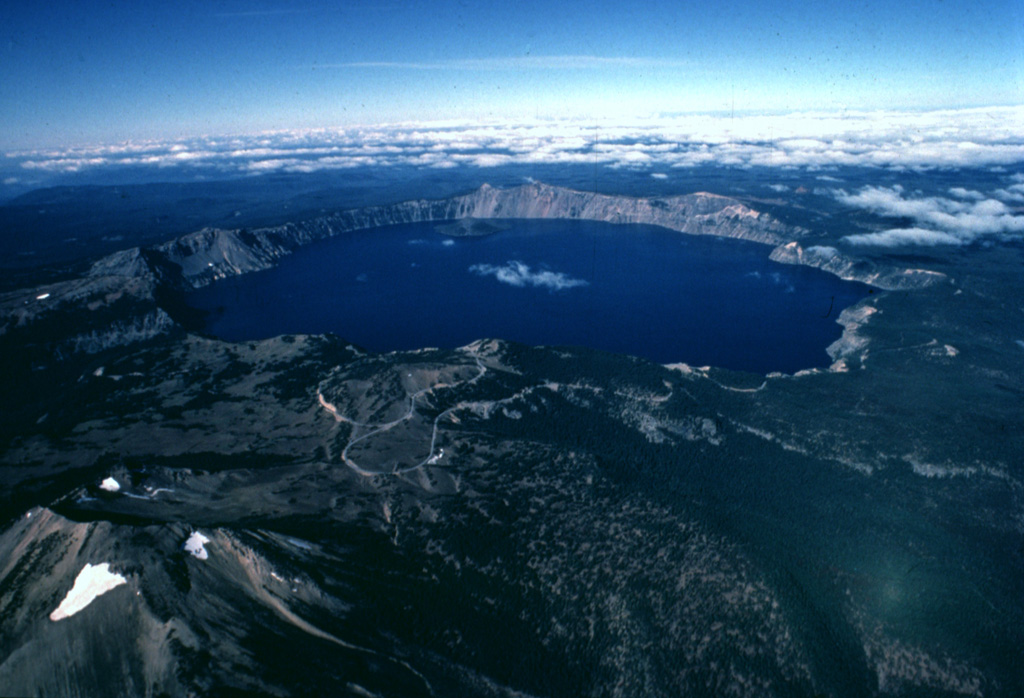

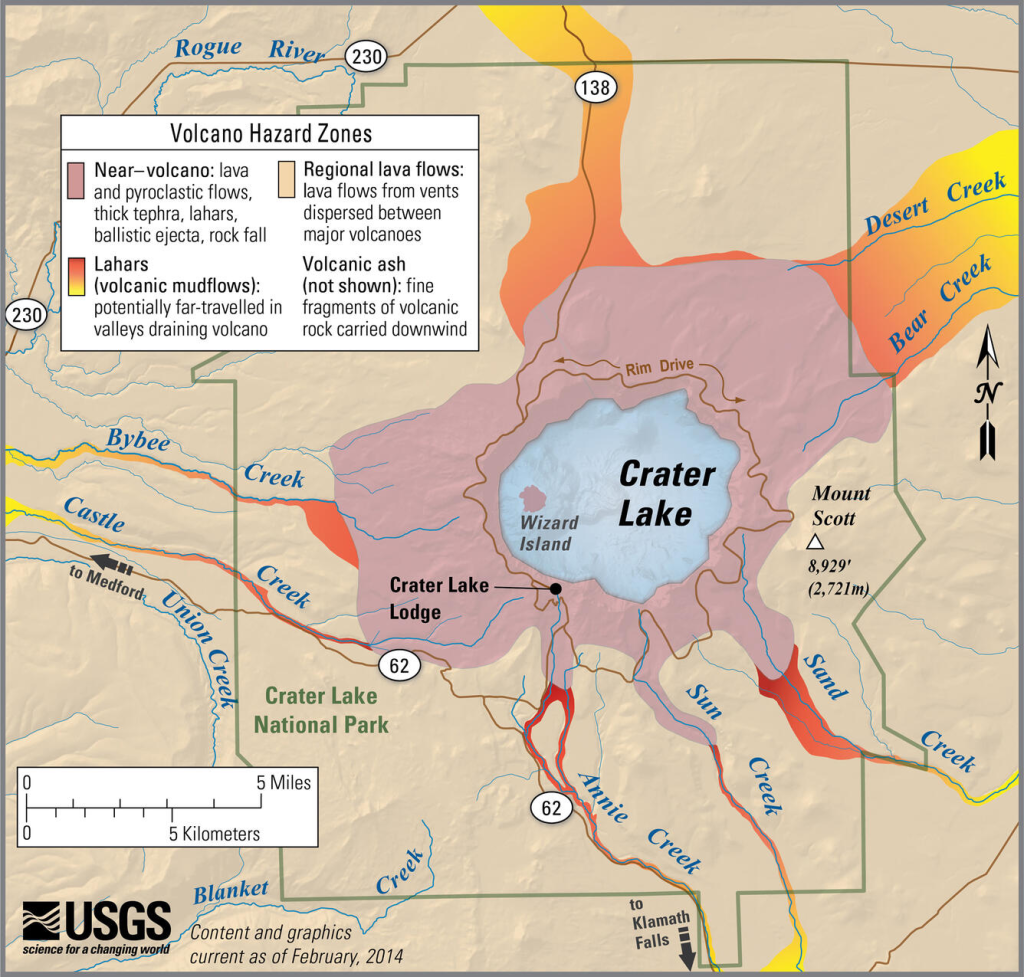
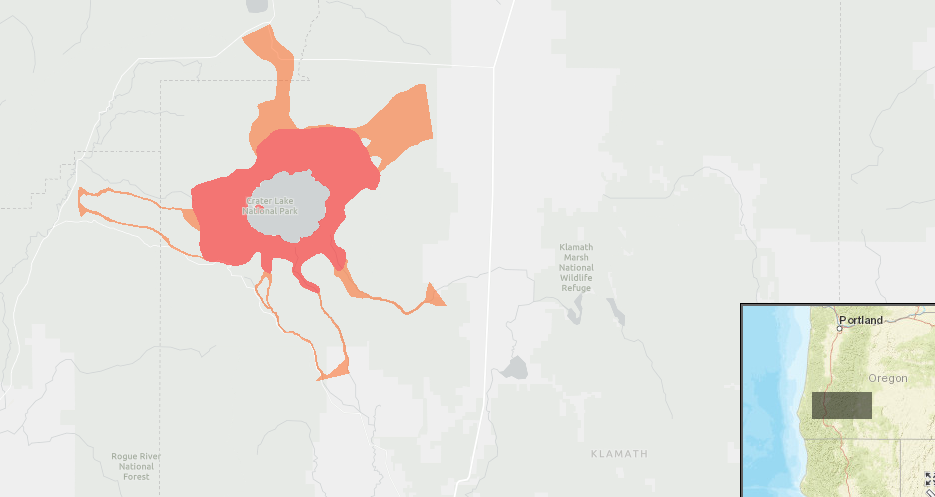


Photo by Peter Lipman, 1981 (U.S. Geological Survey)


Photo by Dave Wieprecht, 1995 (U.S. Geological Survey)


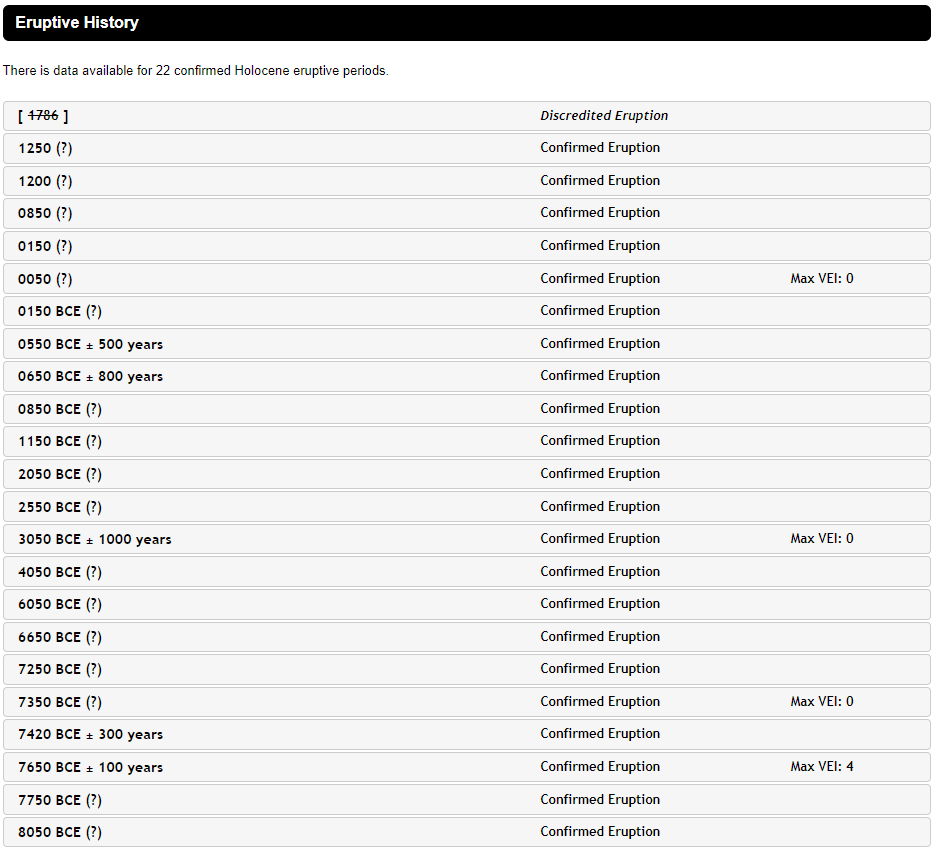


Photo by Lyn Topinka, 1984 (U.S. Geological Survey)

There is currently important research occurring at an offshore volcano called the Axial Seamount (left image below). The research may help predict future eruptions at volcanoes around the world. Check out this 5-minute video by OPB for more information (the Sea Shanti remix at the beginning is fun!). You can visit the University of Washington’s Axial Seamount Earthquake Catalog here, and the Oregon State University’s Blog to chronicle eruption forecasts at Axial Seamount here.


According to the USGS, from about 16.7 Ma to 5.5 Ma, the hot spot that now fuels Yellowstone is believed to have been the source of a series of lava flows that covered a vast region in the Pacific Northwest.
“The Columbia River Basalt Group (CRBG) is the youngest, smallest, and one of the best-preserved continental flood basalt province on Earth, covering over 210,000 km2 of mainly eastern Oregon and Washington, western Idaho, and part of northern Nevada.”
