Tsunami is Japanese for “harbor wave”. Unlike surface waves, tsunamis are columns of energy that push columns of water from the ocean floor to the surface in all directions.
Asteroids, landslides, volcanic eruptions, and subduction zone megathrust earthquakes can all displace massive amounts of water, creating a series of incredibly long waves known as tsunamis. The series of waves is sometimes referred to as “wave trains”—incredibly fast and powerful, with lots of “cars/coaches” coming one after another.
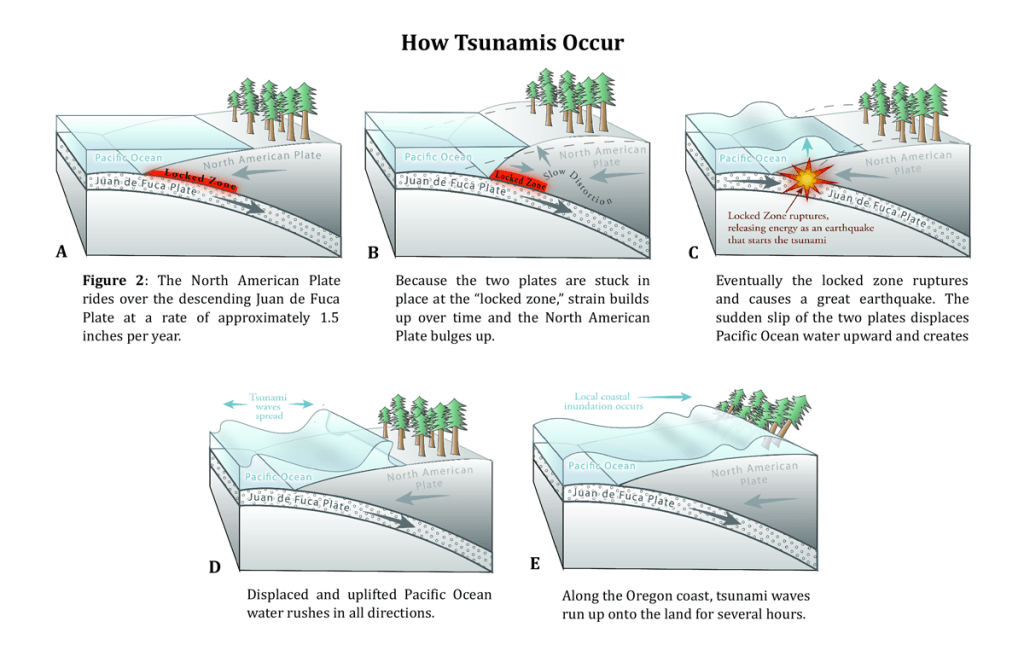
“In Cascadia, you have one plate diving down beneath another. [One] section gets locked, and it pushes [another] part up. When the fault ruptures, when the amount of stress overcomes the friction, [the part that is stuck] bounces back, which lifts up the water above it and causes that water to flow out in all directions. And that water flowing out in all directions is the tsunami.” – Wendy Bohon
The Next Big Earthquake Could Sink Parts of the Pacific Northwest | NOVA | PBS
According to the National Oceanic and Atmospheric Administration (NOAA), a tsunami wavelength from crest to crest can be hundreds of miles wide. As shown here, tsunamis can travel at the speed of a jetliner in the deep ocean, slowing to around 30 mph near the shoreline.
To view images of historical tsunami damage around the globe, visit NOAA’s database: Natural Hazards Image Database

A magnitude 9.0 Cascadia event may generate multiple tsunami waves (typically 6 to 8 waves) that collectively last 10 to 12 hours after the initial earthquake, according to the United States Government Accountability Office (GAO). However, the Cascadia Rising Exercise Scenario Document states that tsunami waves may surge for up to 24 hours after the earthquake. More, earthquake aftershocks of magnitude 7.0 or greater may follow the initial earthquake, generating additional tsunamis.
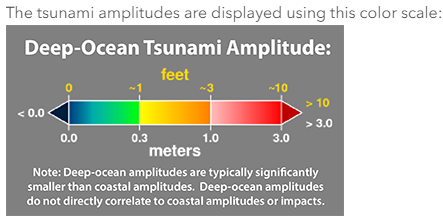
This image from the ESRI Disaster Response ArcGIS database depicts the tsunami energy release following the 1700 Cascadia Subduction Zone (CSZ) earthquake.

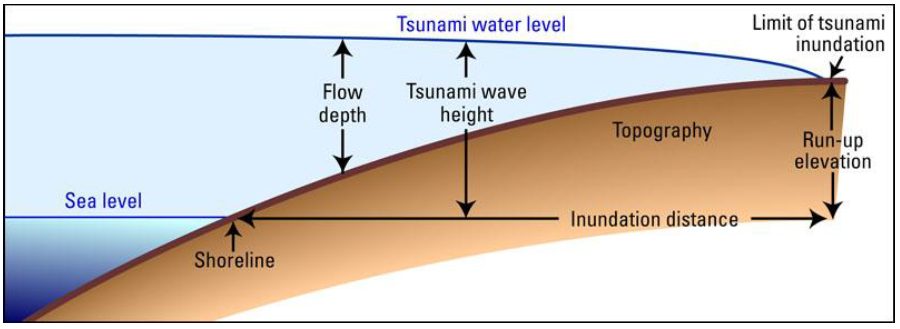
Per the image on the left:
Between the waves coming inland (crests), the water will recede (troughs). Sometimes a trough occurs first, serving as a warning that the tsunami will arrive soon. Here is an observation from Somalia after the 2004 Indian Ocean tsunami. “At first, a 100-m drawback was noticed, followed by a first wave flooding the beach. Next, the water withdrew again by 900 m before the second wave partially flooded the town. Finally, the water withdrew again by 1,300 m offshore before the third and most powerful wave washed through the town. These drawbacks correspond to 0.5-m, 4-m, and 6-m depths.”
The average time between crests is 10 to 45 minutes.

The United States Government Accountability Office (GAO) estimates that the initial tsunami wave following a Cascadia Subduction Zone (CSZ) earthquake will range from 3 to 80 feet high, depending on the topography at each location along the coastline.
The initial wave isn’t always the largest.
The GAO report cited above also states, “In general, if a person is caught where the tsunami is over six feet deep, then death is likely.”
According to the National Weather Service, “6 inches of fast-moving water can knock adults off their feet and sweep them away. 12 inches of moving water can carry off a small car. 18 to 24 inches of moving water can carry away larger vehicles, including trucks, vans, and SUVs.”
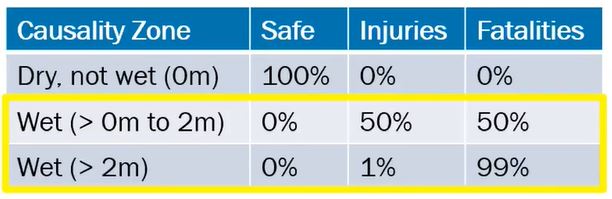
The image below from the Cascadia CoPes Hub webinar, “The New National Risk Index (NRI) and Opportunities to Build Resilience to Coastal Hazards in Cascadia,” states that anyone caught in a tsunami at a depth of 2 meters or more has only a 1% chance of survival. Water levels below that height give the individual a 50/50 chance of survival… but survival does not equal “free of injury.”
Most two-story homes are about 20 to 25 feet tall. Three-story single-family homes and townhouses typically range between 30 – 35 feet above the existing grade. This is relevant because Tillamook County, Oregon, has local building codes that stipulate maximum building heights of 35 feet above existing grade, except on ocean- or bay-front lots, which can’t exceed 24 feet above existing grade. Similar codes exist up and down the coast. If a home is at low elevation (beachfront), an 80-foot tsunami would be well above its height (don’t go up on the roof!). The best chance of survival is to get to high ground before the waves arrive.
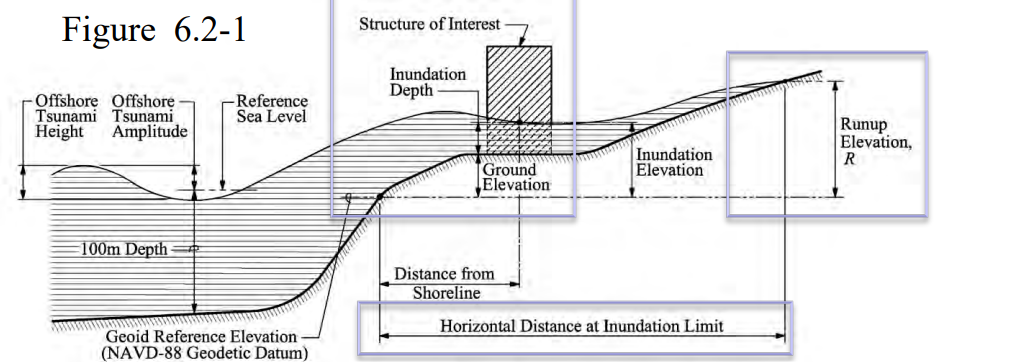
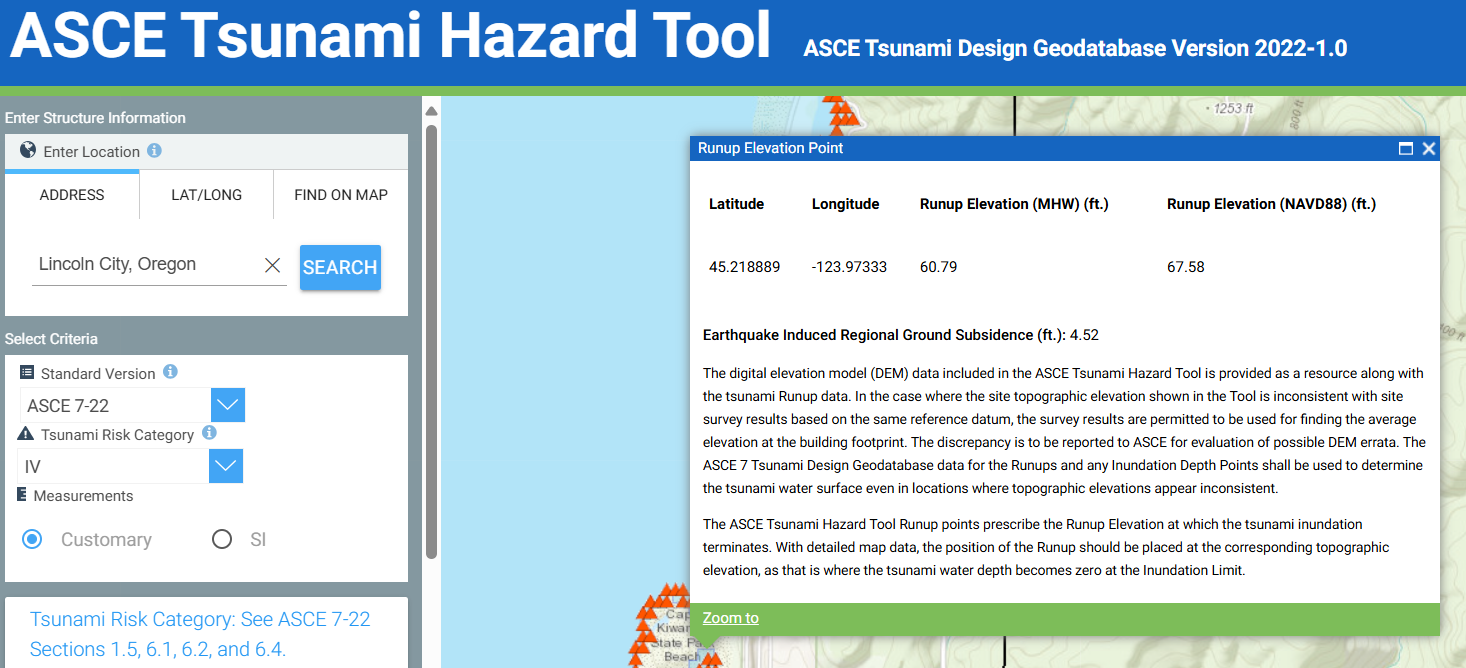
The tool below provides Runup Elevations; the highest land elevation point is where the tsunami stops traveling inland – not to be confused with the Inundation Depth that estimates how deep the tsunami could be at a given location. However, when the tool displays red circles (rather than red triangles), clicking a red circle shows the estimated inundation depth.
The best way to survive a tsunami if you are in an inundation zone when the earthquake happens is to begin evacuating as soon as the shaking stops. Don’t wait around. That sounds obvious, but take a look at just how critical that timing can be.

DOGAMI’s December 2024 publication, Vertical Structures and Other Tsunami Evacuation Improvement Options in Seaside and Cannon Beach, Clatsop County, Oregon estimates that it takes an average of 7 minutes for individuals to:
- Move through disorientation and shock, and collect family members, go bags, etc.
- The time required to evacuate the building and reach the nearest road in order to reach the start of the evacuation route(navigating fallen debris inside the building, exiting the building, crossing the fenced yard, etc.)
The publication then conservatively adds three minutes to the “pre-evacuation phase” in order to account for the estimated shaking duration. Together, they assume the average person will wait 10 minutes from when the shaking starts until the evacuation begins.

Seven minutes can go incredibly fast when you are trying to round up loved ones and critical items, but even that short timeframe can be a major mistake. The tsunami is expected to reach the coastline in as little as 7 to 30 minutes after the shaking BEGINS (keep in mind, the shaking may last between 3 and 7 minutes).
A 2025 analysis in the International Journal of Disaster Risk Reduction, titled “National population exposure and evacuation potential in the United States to earthquake-generated tsunami threats,” illustrates the importance of quick evacuation. The paper discusses evacuation timing as:
- No departure delay assumes individuals begin evacuating immediately after an earthquake begins, though this is purely for modeling purposes, as immediate evacuation may not be feasible during strong ground shaking.
- A 5-min delay assumes individuals shelter in place (i.e., “drop, cover, and hold on”) during earthquake ground shaking, which varies but is estimated to be 3–5 min for many subduction zone earthquake sources and then proceed to evacuate once shaking has stopped.
- A 10-min delay assumes individuals wait for ground shaking to end and then take additional time to orient themselves, leave buildings, and evacuate to high ground.
- The paper also states that in Japan during the 2011 Tohoku earthquake and tsunami:
- 14 % of survivors evacuated immediately,
- 17 % in the first 1–5 min after ground shaking,
- 19 % of survivors in 6–10 min
- The remaining 50 % of survivors took more than 10 min.
- The average time is 14–34 minutes after the earth stopped shaking (per DOGAMI’s 2024 publication above)

As these figures demonstrate, evacuating quickly can mean the difference between life and death. Building Vertical Evacuation Structures (VES) to shorten the distance to safety can save hundreds to thousands of lives.
An EOS article explains, “Earthquakes and other natural events sometimes shake the seafloor near coastlines severely enough to cause underwater avalanches that rush down steep slopes, scouring the seabed and carrying sediment to greater depths. These fast-moving sediment-laden flows [are] called turbidity currents. When sediment settles, it leaves a turbidite layer, and these layers have helped scientists reconstruct the history of past Cascadia events.
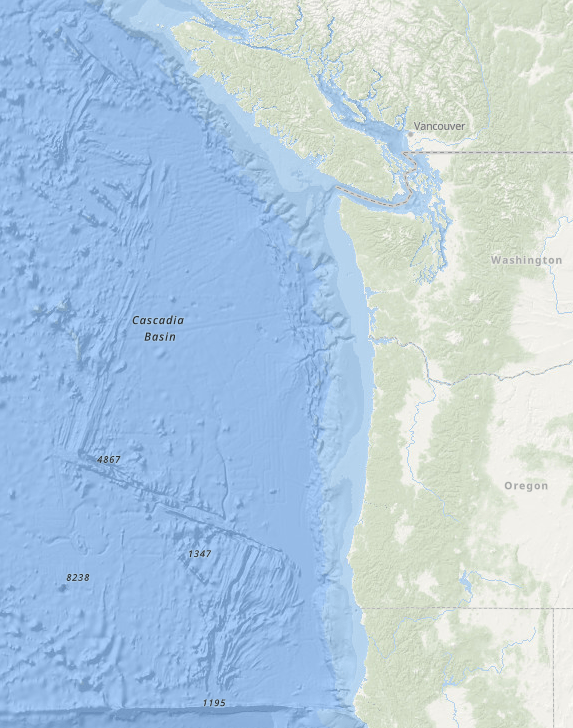
The study of the depth of ocean floors (also known as seabed topography), lake floors, or river floors is called bathymetry. Along Cascadia, this data is critical for tsunami modelers to estimate wave speed, height, and arrival times, all of which are essential for developing tsunami inundation and evacuation maps. To view bathymetric data along Cascadia, visit:
NOAA’s Bathymetric Data Viewer: Bathymetric Data Viewer

The Northwest Association of Networked Ocean Observing Systems (NANOOS) has an interactive tsunami map—the NANOOS Visualization System (NVS)—showing “predictions for the estimated maximum extent of inundation for all of Oregon and Washington overlaid on Google Maps.” The maps are absolutely worth checking out because…
When the earthquake hits, the shaking will most likely be the ONLY warning you’ll get that a tsunami is coming. As soon as the earth stops shaking, move to high ground!! Don’t hesitate. Don’t wait for a tsunami siren to blare. It probably won’t. Just go.
How fast will you need to move? Based on the table in the section above… definitely faster than a slow walk. But what’s a “slow walk”? The Oregon Department of Geology and Mineral Industries (DOGAMI) provides the following information on walking speeds, age-based speeds, and speed adjustments based on path type. Note that when moving on loose beach sand, your normal walking speed is cut by more than half.
A reminder: tsunamis travel at about 30mph once they hit the shoreline. As you can see below, it is unlikely you can sprint faster than 10mph, even if you are in incredible shape. Don’t wait until you can see the waves. You can’t outrun them once they get to shore.
Figuring out how fast you’ll need to move based on where you are when this happens is tricky! Thankfully, DOGAMI has developed Beat the Wave maps. They show the speed at which you will need to move based on specific locations you may be in when the tsunami hits. To see the map for your area (only covers Oregon) or a coastal area you plan to visit, click here.
Visit the American Red Cross for more tsunami preparedness information.
National Oceanic and Atmospheric Administration (NOAA) Pacific Marine Environmental Laboratory (PMEL) provides a Recent and Historical Tsunami Events and Relevant Data map page and an Oceans and Coastal Processes Research page worth viewing.

Did you know tsunamis often generate whirlpools? This image of a whirlpool generated by the March 11, 2011, Tohoku Tsunami comes from aerial footage taken during the tsunami.
Image: NOAA’s PMEL
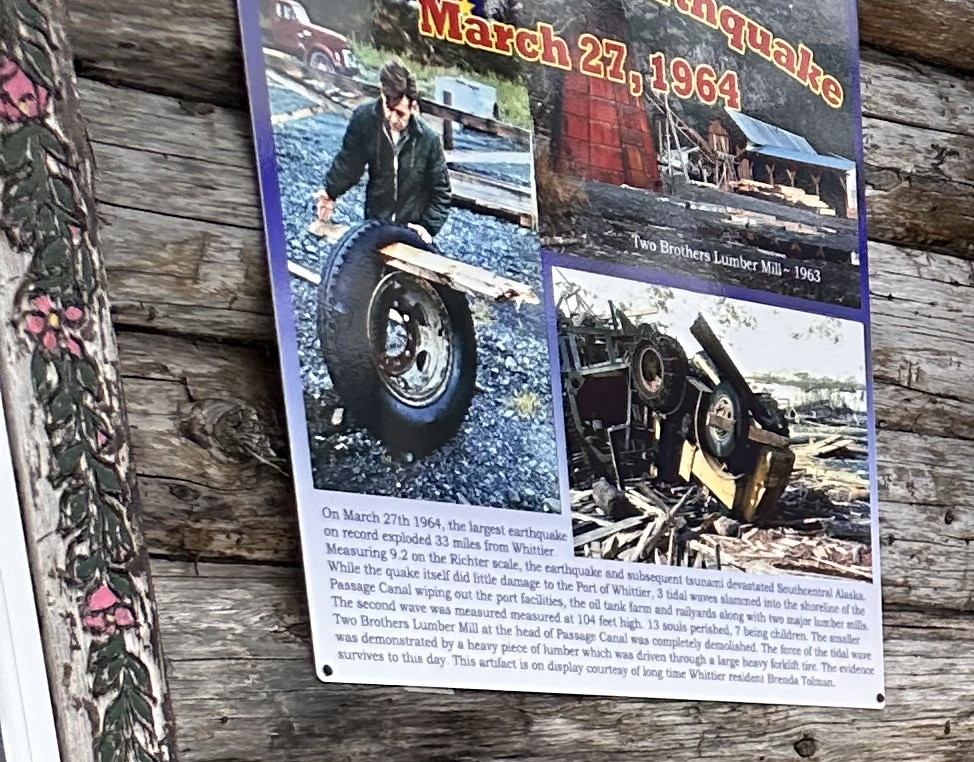
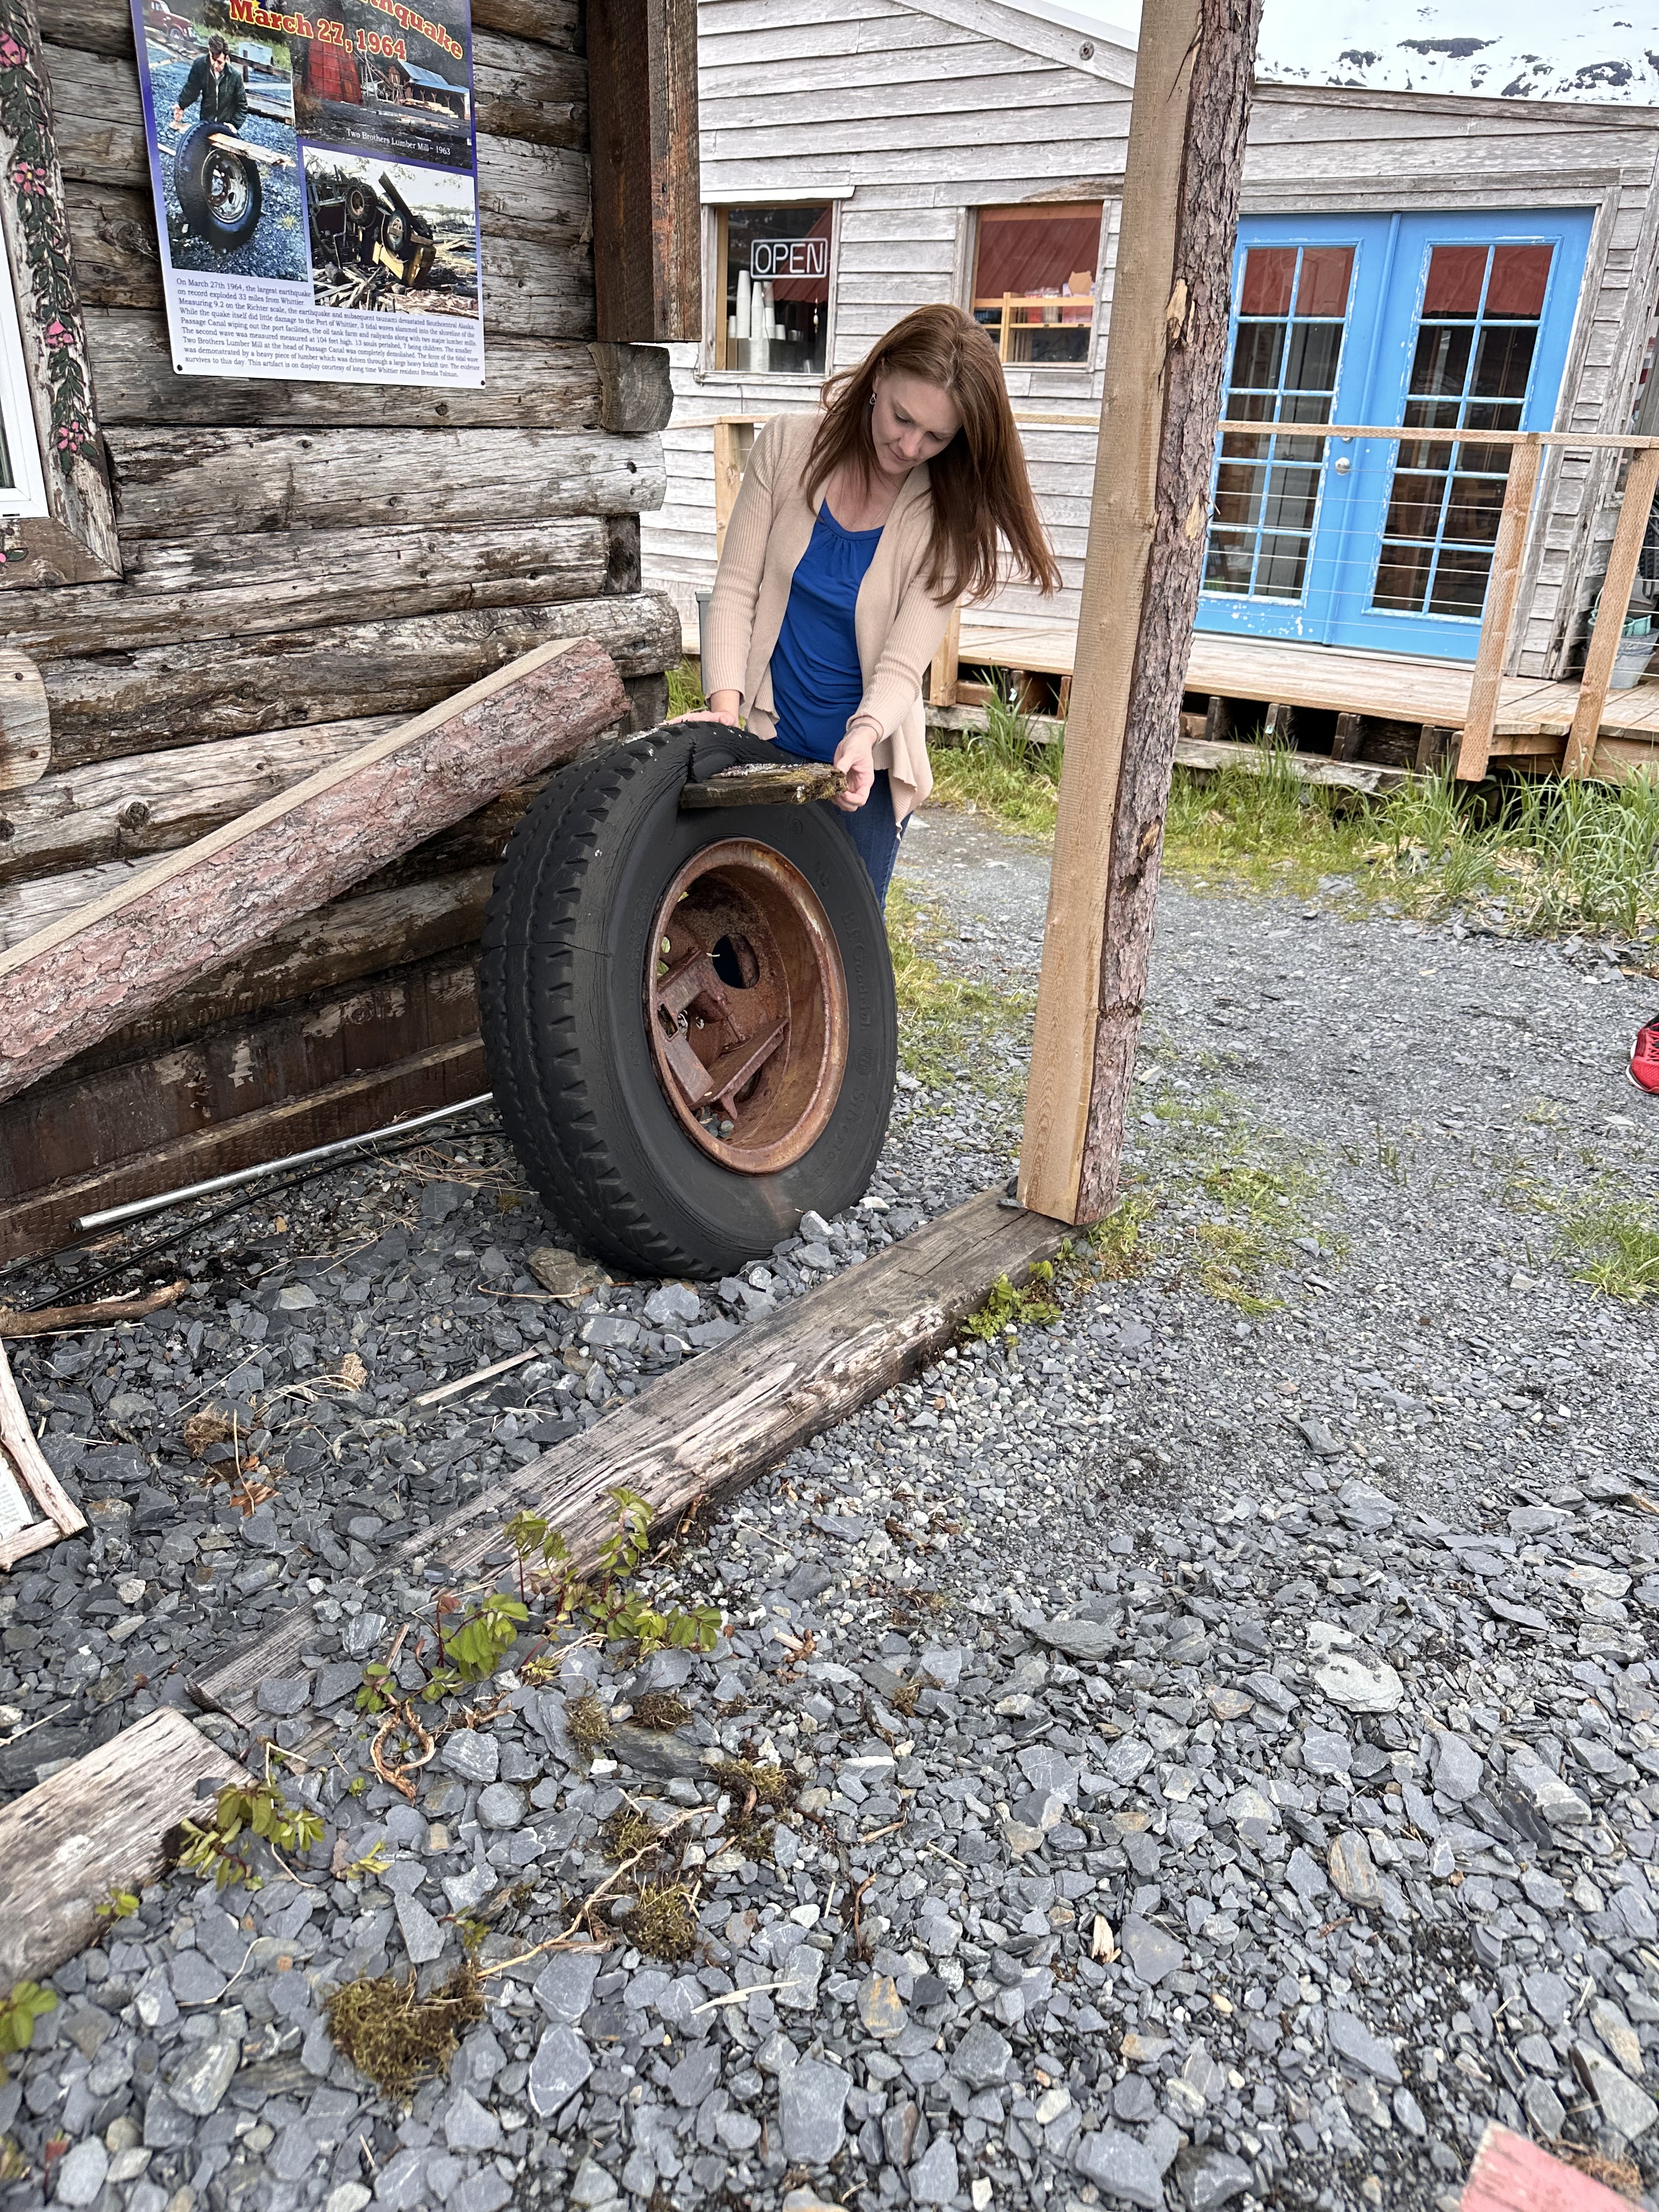
I took this photo in Whittier, Alaska, during the annual National Tsunami Hazard Mitigation Plan (NTHMP) meeting. The tire was impaled by the piece of lumber during the March 1964, M9.2 subduction zone earthquake, often referred to as the Great Alaska Earthquake or the Good Friday Quake. The tire sits behind a small store in Whittier, Alaska as a reminder of the force of tsunamis and the dangers of debris (to help citizens understand that tsunami fatalities aren’t primarily caused by drowning).
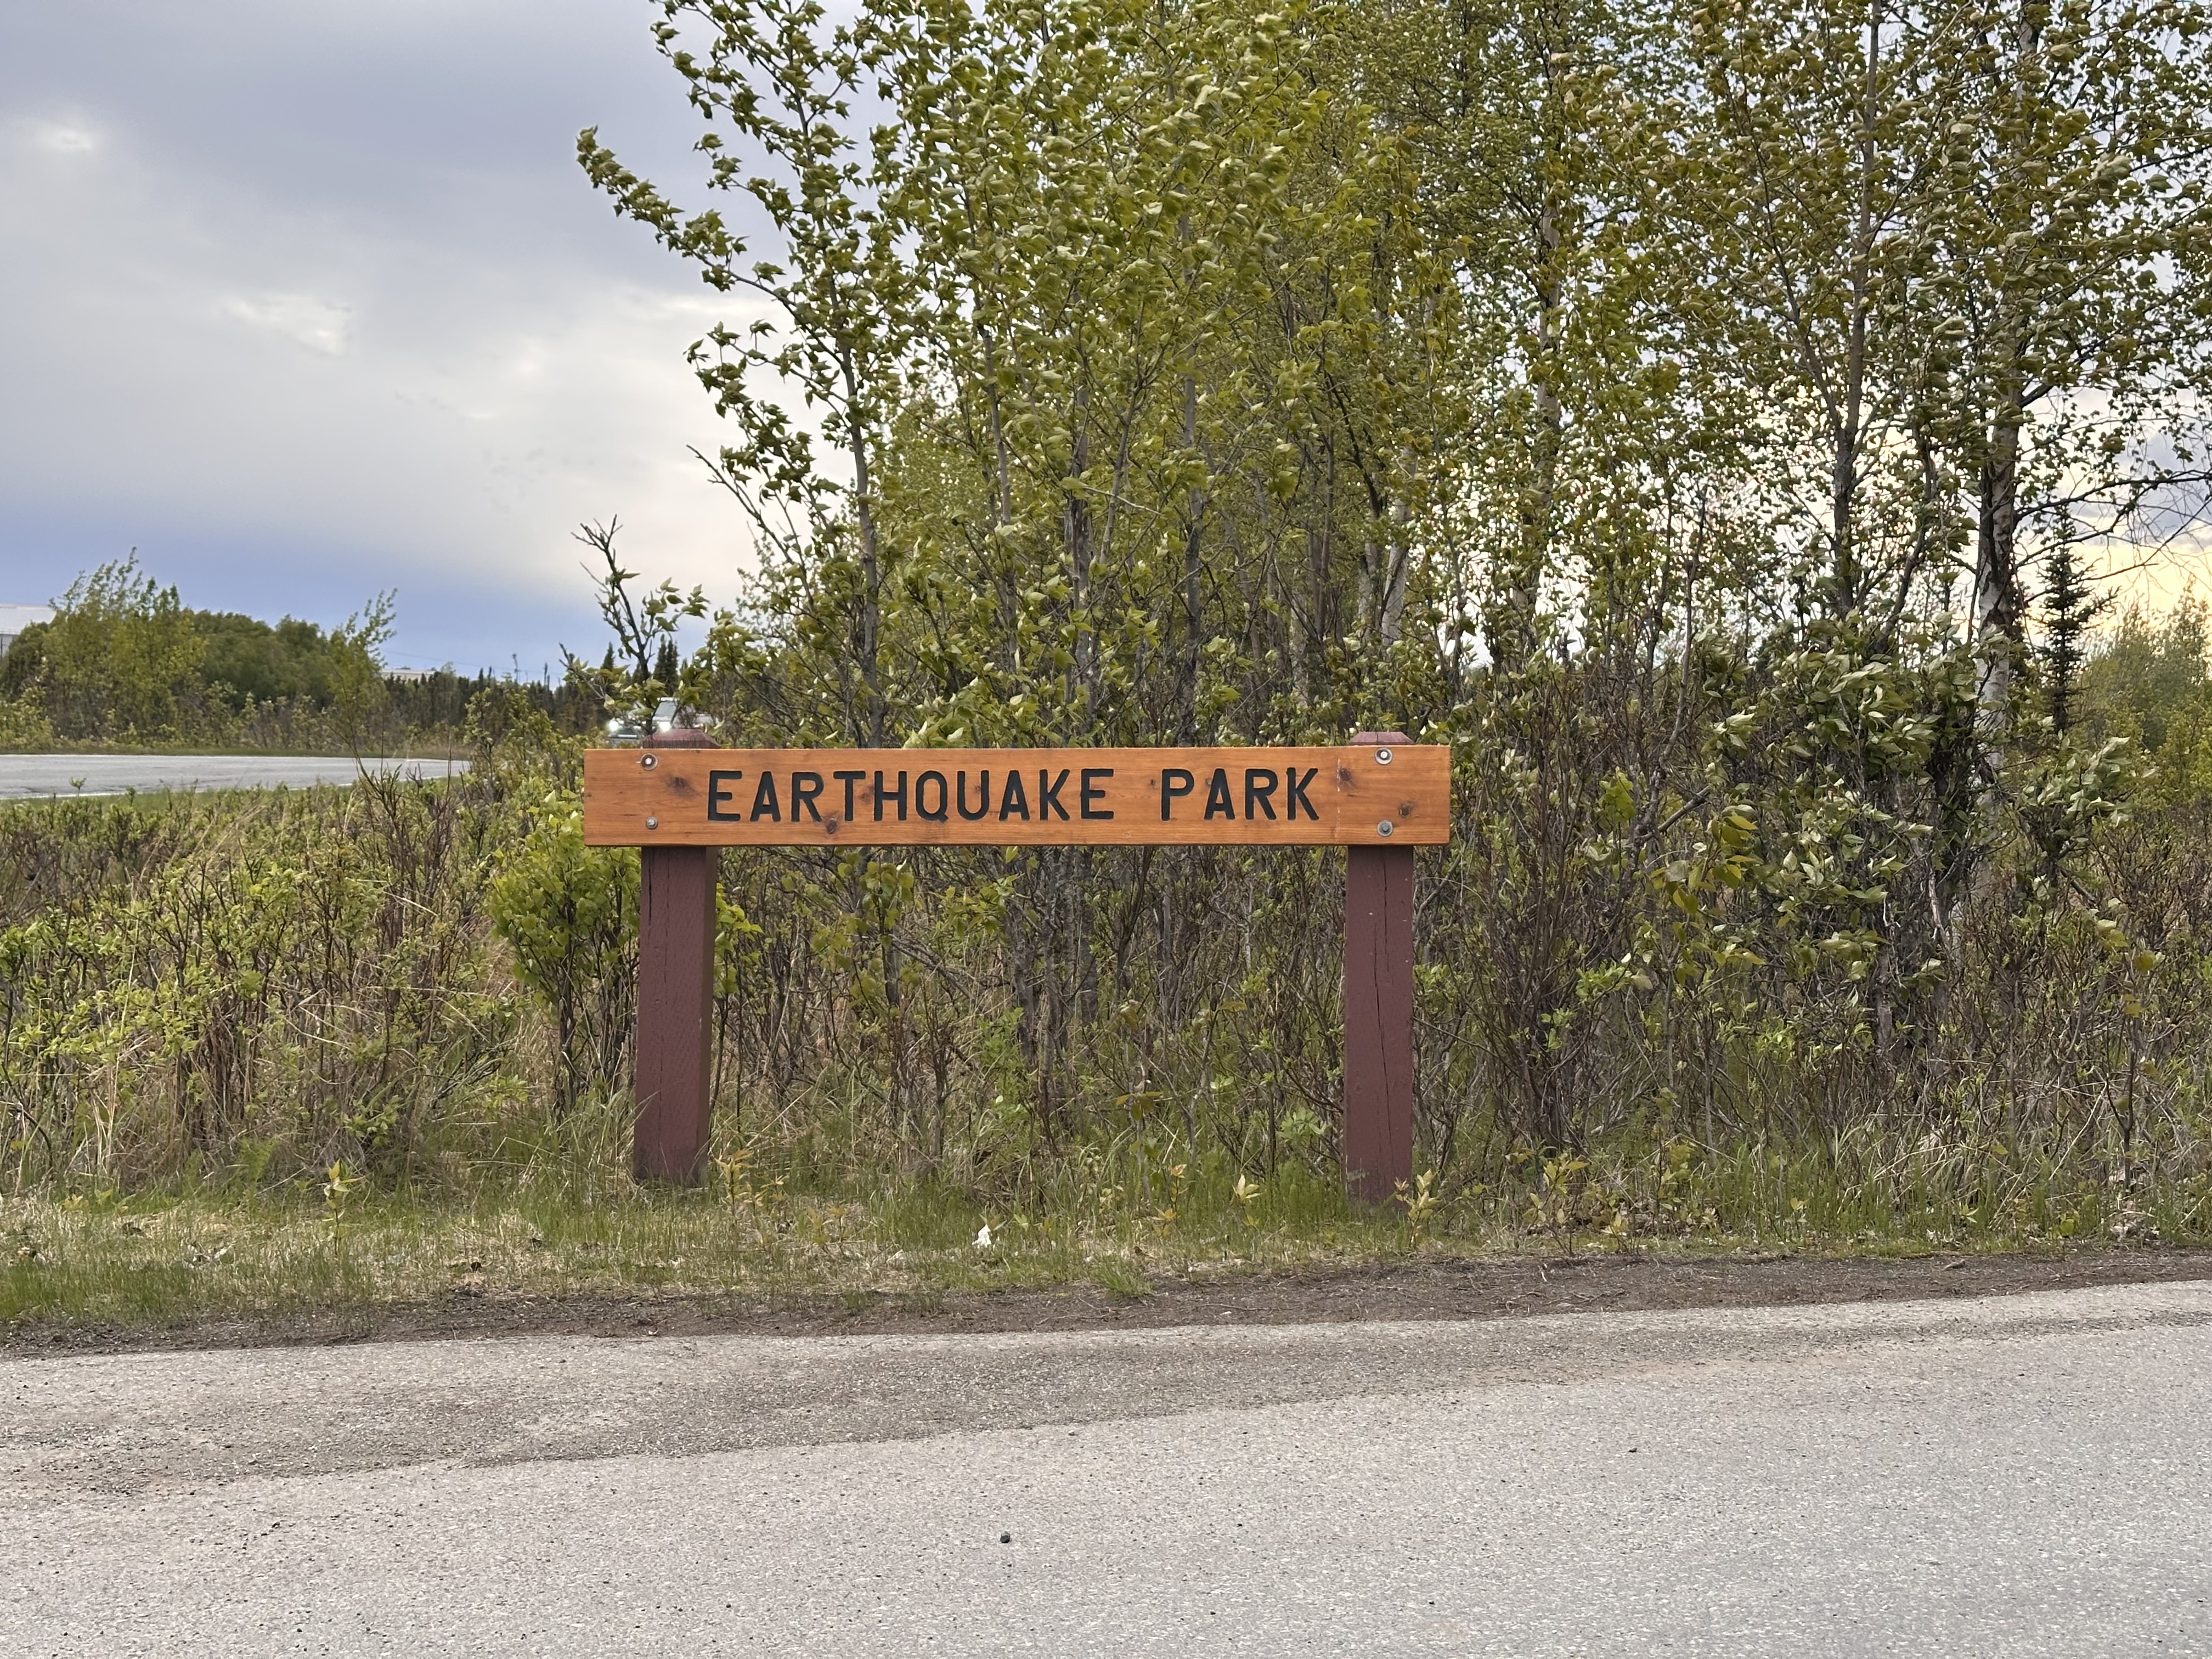
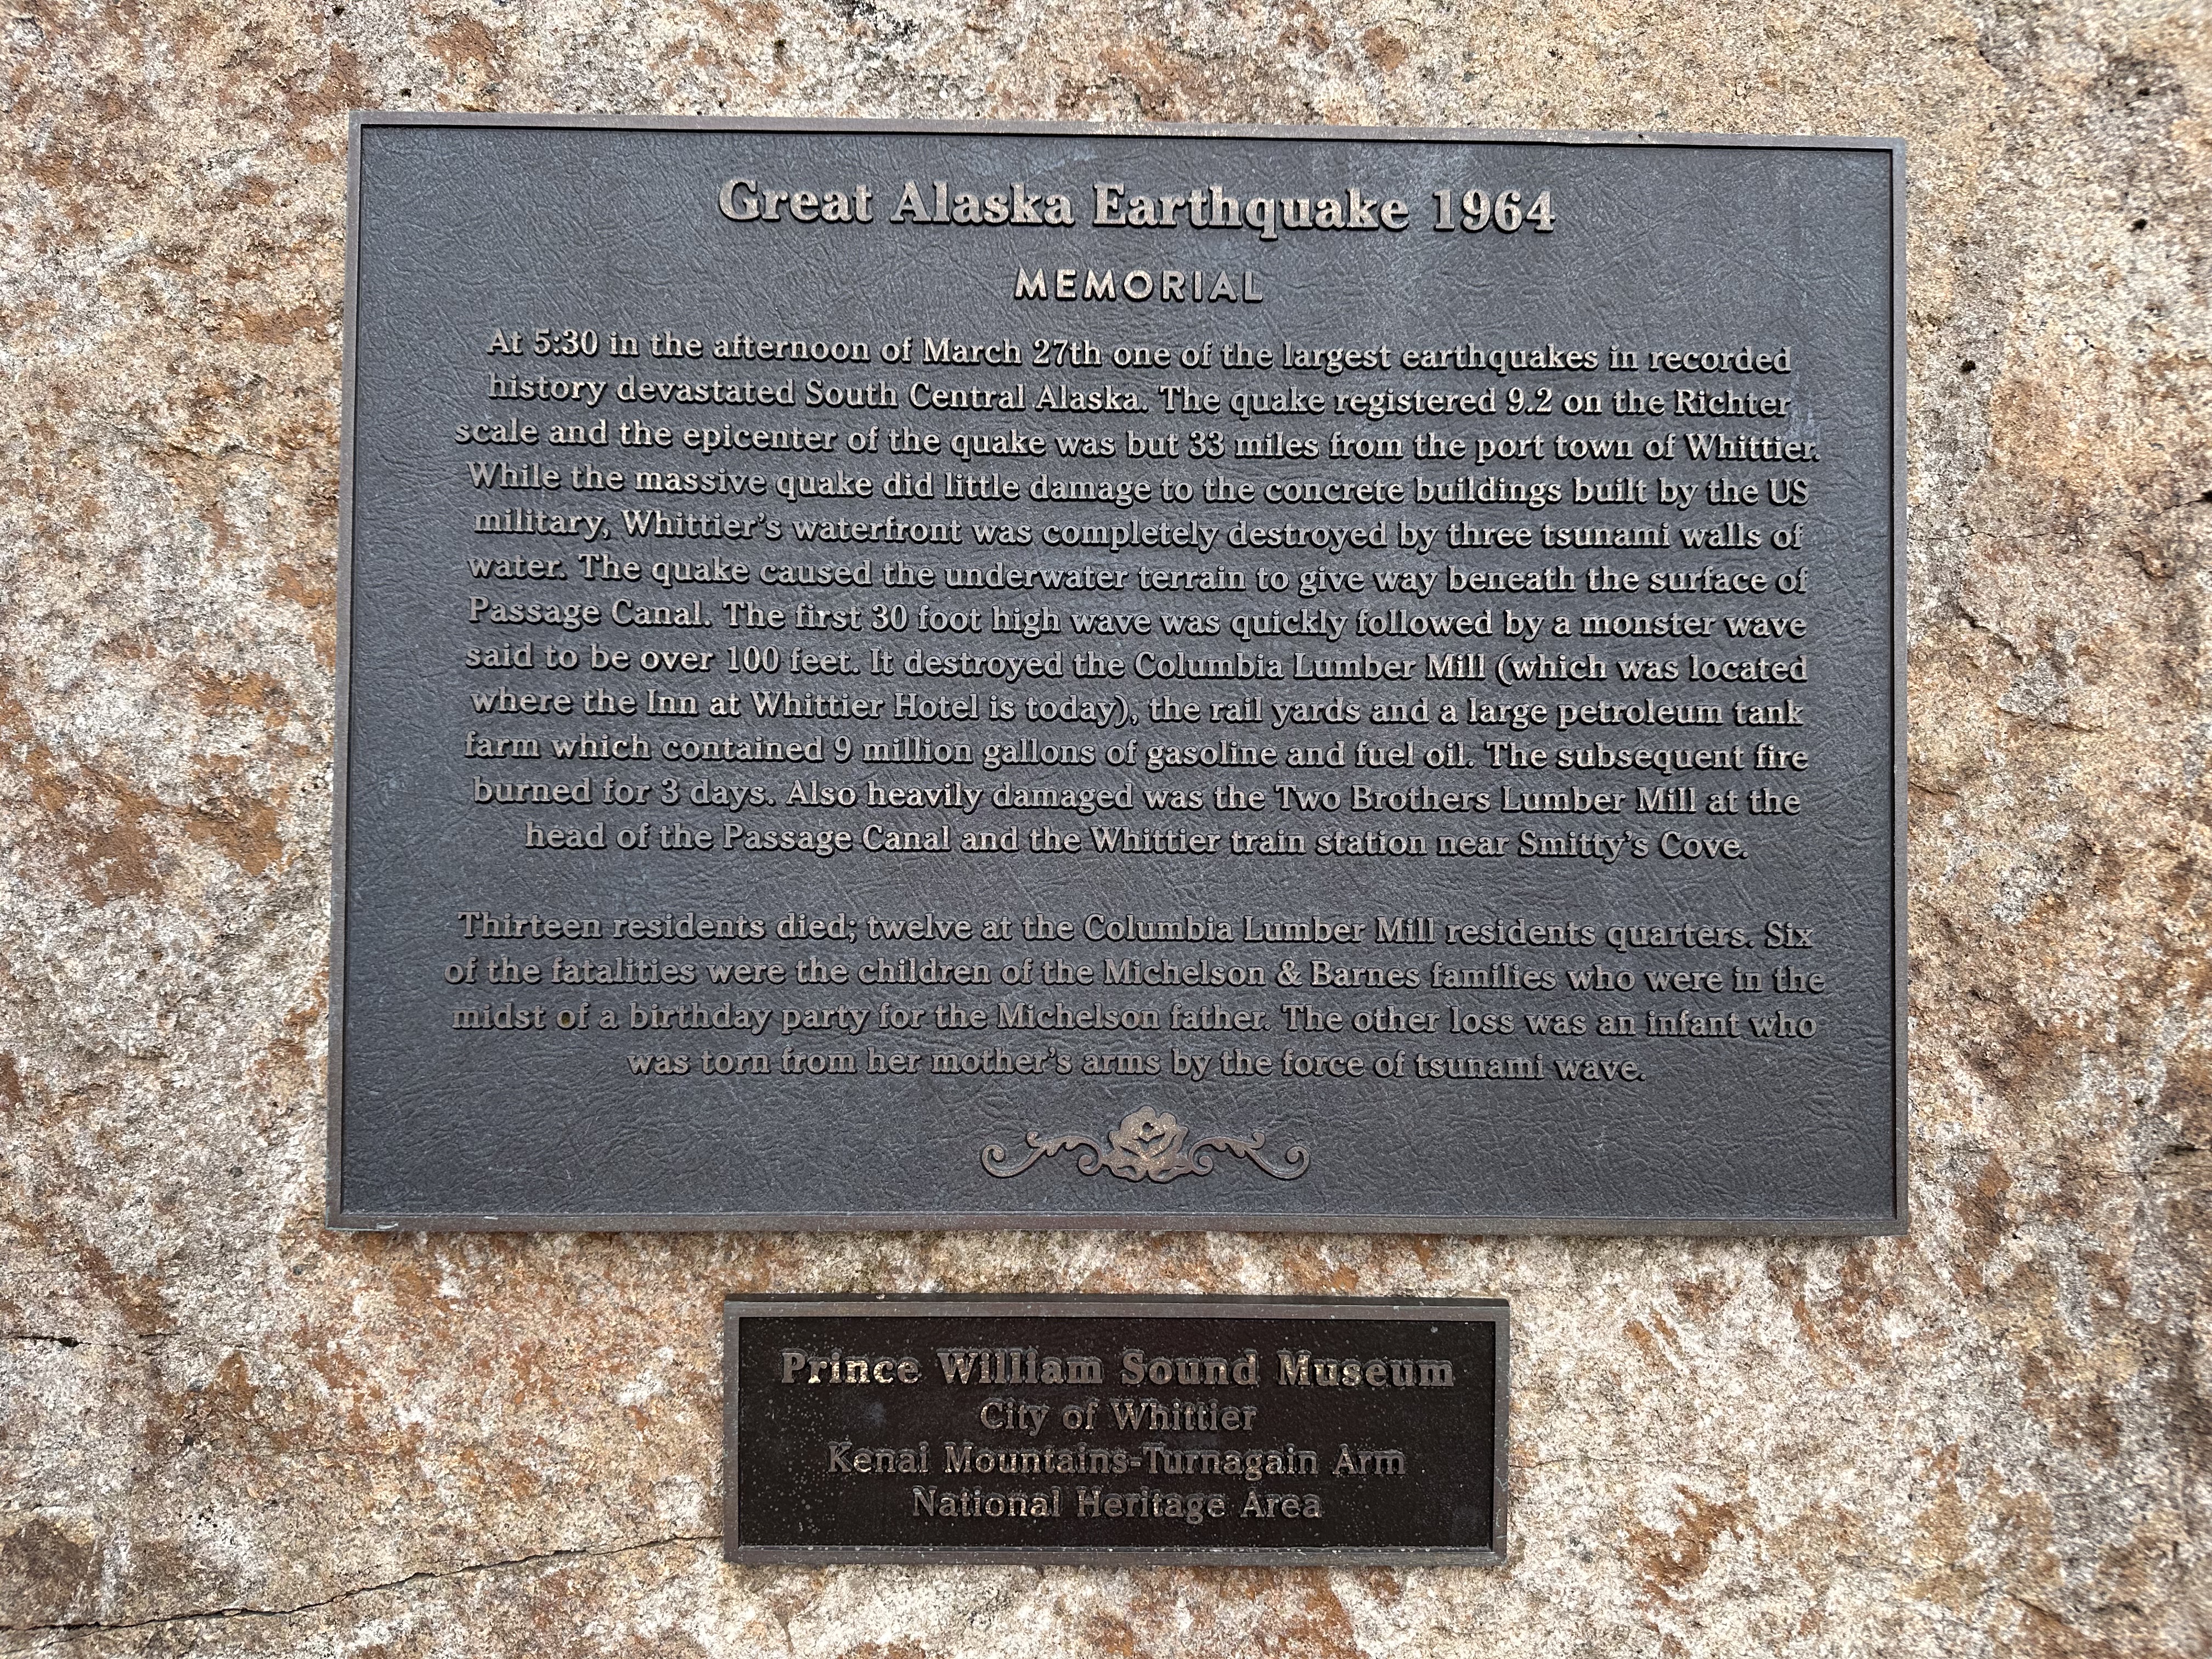
Below are a few other pictures from Whittier and Earthquake Park in Anchorage, Alaska.


The United Nations Office for Disaster Risk Reduction (UNDRR) provides the following Inclusion, Diversity, Equity and Accessibility (IDEA) video on their World Tsunami Awareness Day page.
They also offer this free 8-page publication: World Tsunami Awareness Day: Fighting inequality for a resilient future
Frequency Discussion: The following recurrence intervals are presented by DOGAMI. However, this looks at how many years, on average, pass between two events of similar size. It does not provide recurrence intervals for local-source Cascadia tsunamis of all sizes (S, M, L, XL). For a look at average recurrence intervals between Cascadia megathrust events (that produce tsunamis of various sizes) see Likelihood of an 8.0 – Surviving Cascadia.
- Small (SM), these events have a mean inter-event time of 300 years
(range=~110 to 480 years, 5 events) - Medium (M), 525 years (range=~310 to 660 years, 10 events)
- Large (L), 800 years (range=~680 to 1,000 years, 3 events)
- Extra Large (XL), 1,150 years (1 event), rounded to 1,200 years
