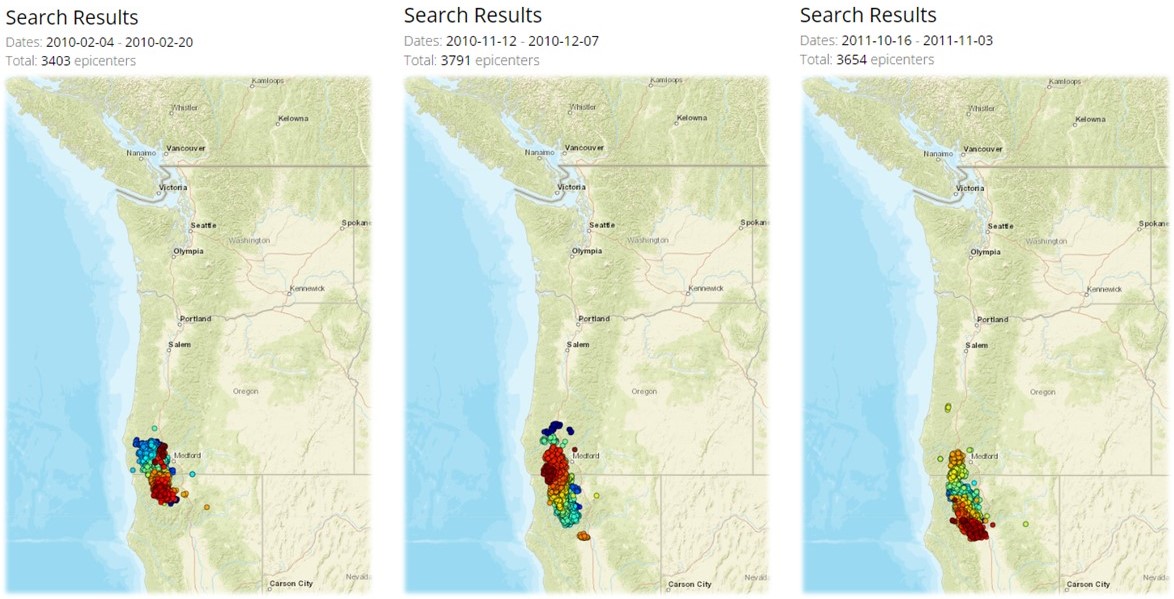
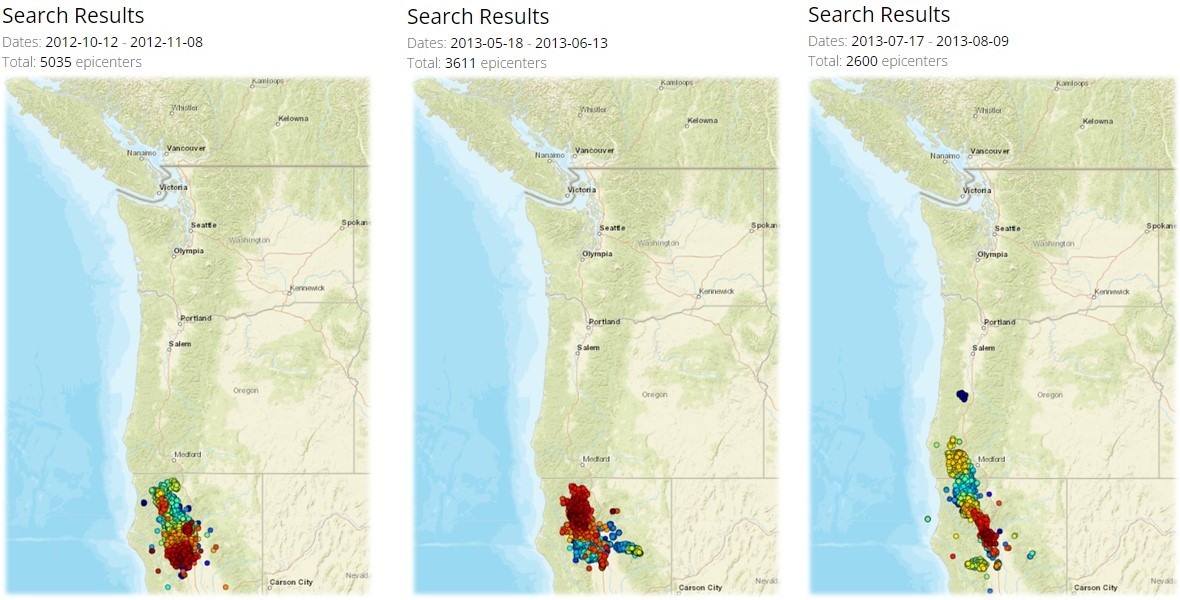
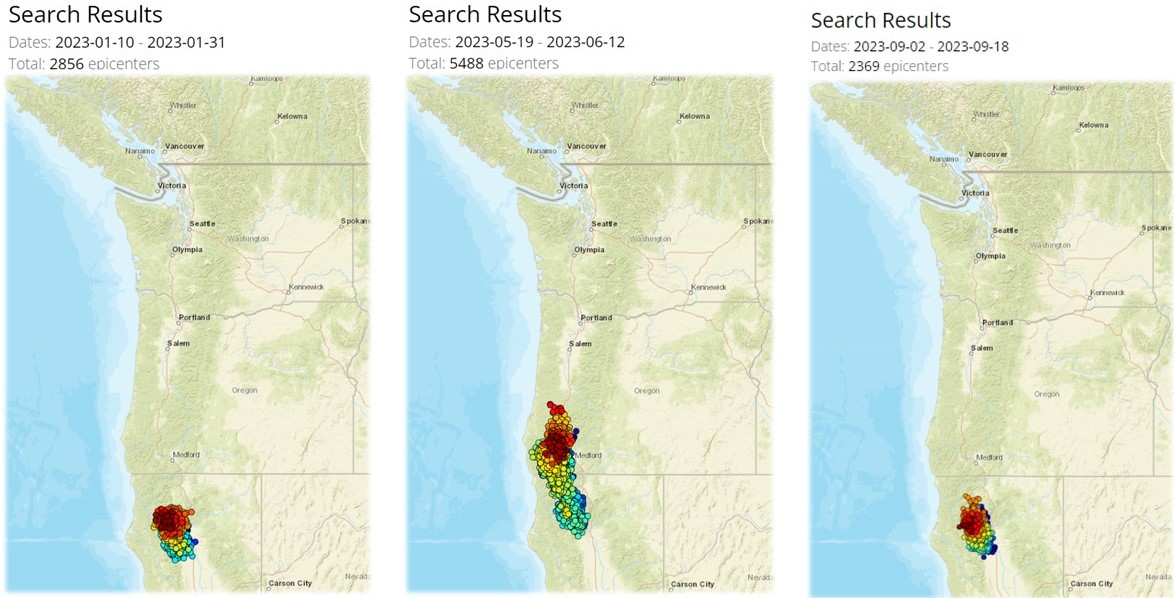
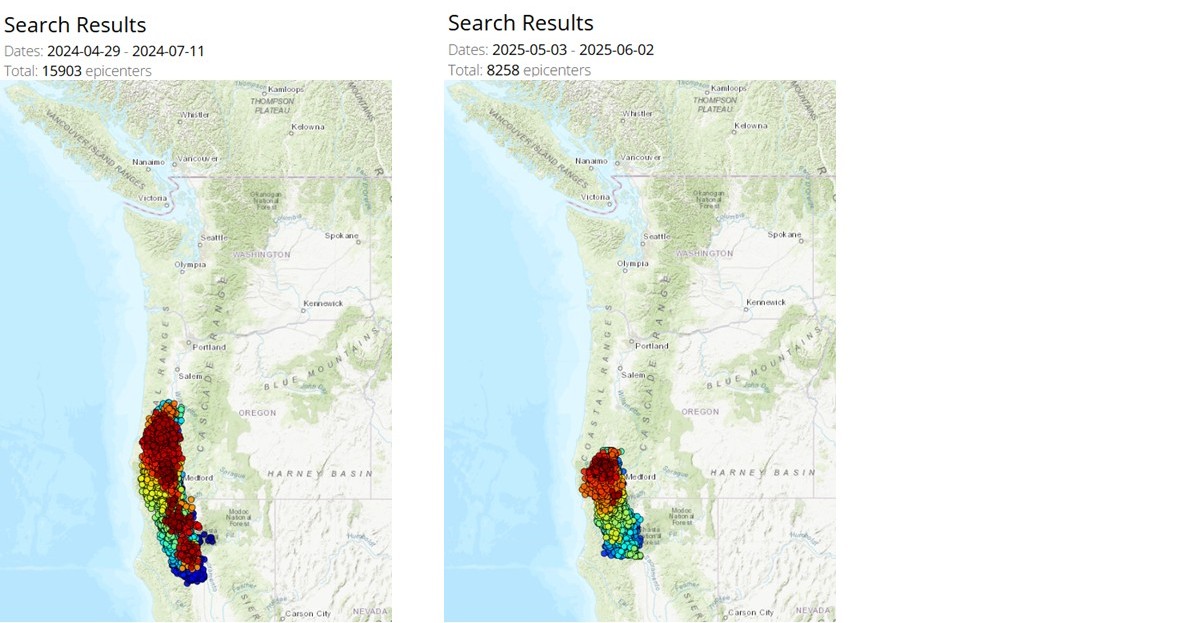
While dates for Episodic Tremor and Slip (ETS, aka slow-slips) events in the northern region match up with those listed on the Pacific Northwest Seismic Network’s (PNSN) Tremor Logs, there currently aren’t compatible logs for the southern ETS region.
However, this PNSN Cascadia Tremor Swarms graphic, along with observations of tremor migration patterns (activity that doesn’t just clump, but moves along a path over several days) and number of days of activity (at least two weeks), provide my best-guess estimates for southern activity.

UW Emeritus Professor Ken Creager posted the above Cascadia Tremor Swarms graph. The events are plotted by date and latitude as of 4/6/2022. The post states:
“Individual tremor epicenters are shown as black dots, and tremors that are clustered in space and time are marked by red circles. Those with more than 50 hours of tremor show the hours as white numbers.”