

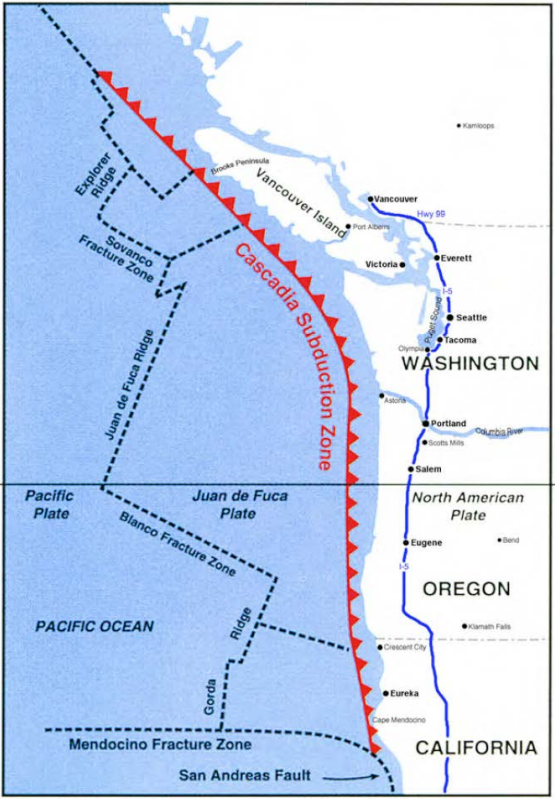
The infamous San Andreas Fault runs more than 800 miles from the Salton Sea in the south to meet the Cascadia Megathrust Fault at the Mendocino Triple Junction in the north.
Research published in September 2025 provides evidence of partial synchronization between the Northern San Andreas Fault (NSAF) and the Cascadia Subduction Zone (CSZ).
During the most-recent 3,000 years, in particular, major ruptures along CSZ have often ruptured in sync with the NSAF. Below are three quotes from relevant publications on the topic. Click the headers to link to the sources.

“If Cascadia went off, I would take that pretty seriously [as] a very clear advance warning for the northern San Andreas,” – Chris Goldfinger
“Cascadia and San Andreas fault zones appear to generate synchronized earthquakes.”
The study found evidence that within minutes to days of the 1700 magnitude 9.0 Cascadia earthquake, a magnitude 7.9 earthquake ruptured along the Northern San Andreas fault NSAF, traveling from Cape Mendocino toward San Francisco. Some NSAF ruptures may have followed behind the CSZ rupture months to years later; however, most of the recent events during the past 2,500 years appear to have had much shorter intervals.
The only exception throughout the last 2,500 in which a major quake on the northern San Andreas fault wasn’t preceded by a huge quake on the Cascadia subduction zone was the 1906 event.
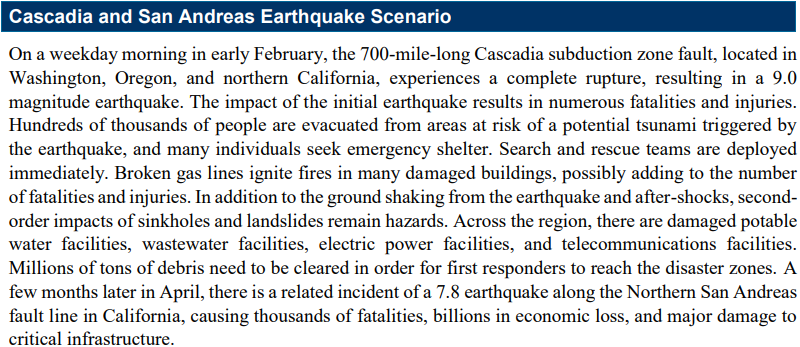
Just “one of these big events will draw down the resources of the whole country trying to respond to it,” Goldfinger said. “So, if you have two of those, you double up on that.”
“As a funny postcript to this story, a movie came out in 2005 called “10.5”… The USGS regional hazards Chief at the time called me up to let me know about this movie, in case any press asked questions about it. Such a call from the regional boss was not common, but we had a nice chat. I happened to mention to her the part of this story that we know then, that the Cascadia and San Andreas earthquakes seemed to have the same dates. After about 10 seconds of dead air on the phone she said “For gods sake don’t tell anybody that!” True.“

“The hypothesis of a stress-triggering interaction and partial synchronization of the northern San Andreas fault with the Cascadia subduction zone is supported by the new stratigraphic and radiocarbon evidence of occurrence and timing. The stratigraphic stacking suggests that the Cascadia subduction zone ruptures first, and the northern San Andreas fault ruptures thereafter in most cases.”
Synchronization: The image below, published in the same paper, shows twelve Cascadia Subduction Zone (CSZ) megathrust earthquakes highlighted in green — T1, T2, T3, T3a, T4, T5, T5b, T5c, T6, T7, T8, and T14 — line up quite well (good fit) with ruptures along the Northern San Andreas Fault (NSAF). These likely ruptured “together”.
Triggering: Another thirteen Cascadia Subduction Zone megathrust earthquakes highlighted in yellow — T6a, T6b, T8a, T8b, T9, T10, T10b, T10f, T13, T15, T17, T17a, and T18 — are other “good age fit” scenarios where the CSZ likely triggered a rupture along the NSAF.
More relevant though is that the events are listed chronologically with T0a being the most recent and T18 dating back nearly 10,000 years ago. It’s clear that the two faults become more “synced” in recent millennia.

*Of note, Washington, Oregon and California are home to 157, 296, and 840 miles of coastline, respectively. While the Northern San Andreas Fault (NSAF) measures about a third of California’s length, the amount of coastline that could be affected by a one-two punch within the United States is massive.
Ages for Cascadia’s quakes are located on page 97 of the USGS publication, Turbidite Event History—Methods and Implications for Holocene Paleoseismicity of the Cascadia Subduction Zone. Check out Surviving Cascadia’s Likelihood of an 8.0 and Exploring the Probabilities pages for more details.

While this image, explained in Step 1: Cascadia’s Impact Area, provides general patterns for event sizes, the slideshow images below detail the estimated size of each Cascadia megathrust earthquake during the last ≈10,000 years. T1 is the most recent, T19 the oldest in the series.
These images are part of a PowerPoint presentation saved to the Oregon Legislative Information System (OLIS) website.
Image credit: Goldfinger, C., et al., The importance of site selection, sediment supply, and hydrodynamics: A case study of submarine
paleoseismology on the northern Ca…, Marine Geology (2016), http://dx.doi.org/10.1016/j.margeo.2016.06.008
Here are those same images provided in a timed sequence by OSU Professor Chris Goldfinger.
A previous 2019 National Earthquake Hazard Reduction Program (NEHRP) technical report, Paleoseismic Record of Peninsula Segment Earthquakes on the San Andreas Fault near San Francisco, CA and possible NSAF linkage to Cascadia, also concludes:
- Cascadia triggers the Northern San Andreas fault (not the other way around).
- In several cases, there were only hours of separation at most. Time separation for other CSZ/NSAF ruptures is difficult to gauge but likely does not exceed ~ 30 years.
Image Credit: California Cascadia Subduction Zone Earthquake and Tsunami Response Plan
Southern San Andreas Fault
According to the State of Nevada Joint Information Center, a Southern San Andreas Fault (SSAF) earthquake with an epicenter near the Salton Sea could reach a magnitude 7.8. Its impact area could damage infrastructure 60 miles out from the fault and could result in 50,000 people seeking temporary shelter in Nevada. Of course, the SSAF isn’t the only fault in the area. LA County has a List of Major Active Surface Faults in Southern California. The list itself is two pages long and is followed by 22 pages of fault-specific information.
Northern San Andreas Fault
More relevant to the topic of this website, however, is the Northern San Andreas Fault (NSAF). A Bay Area Threat and Hazard Identification and Risk Assessment (THIRA) lays out a Northern San Andreas Fault rupture scenario, and provides the following details.
| Epicenter: Just outside the entrance to the San Francisco Bay, west of the Golden Gate Bridge | Completely Collapsed Buildings: >1,000 |
| Rupture Length: 300 miles | Rupture: Between the San Juan Bautista area in the south to Cape Mendocino in the north |
| Shaking Duration: 20 – 25 seconds (foreshock) & 45 – 60 seconds (main shock) | People Trapped in Completely Collapsed Buildings: >5,000 |
| Fatalities: 6,600 | Additional People in Need or Search & Rescue: >30,000 |
| Magnitude: 7.9 |
The connection between Cascadia and the NSAF is also discussed in OPB’s article, The Big One, Times 2: Research Shows Cascadia Quakes Sometimes Trigger San Andreas Fault, as well as in the Oregonian, KOIN 6, and by many other news organizations.
If Cascadia, the NSAF and the SSAF were all to rupture at their full lengths, the entire west coast of the US and part of Canada would be affected… and each event would be catastrophic in their own right.
| Cascadia Megathrust Fault | Northern San Andreas Fault | Southern San Andreas Fault | |
| Magnitude | 9.0+ (would include tsunami) | 7.9 | 7.8 |
Thankfully, these faults often break in segments. More, there is a section between the northern and southern San Andreas faults that behaves differently. Part 1: Cascadia’s Impact Area discusses ways that the middle section of Cascadia behaving differently, as well.
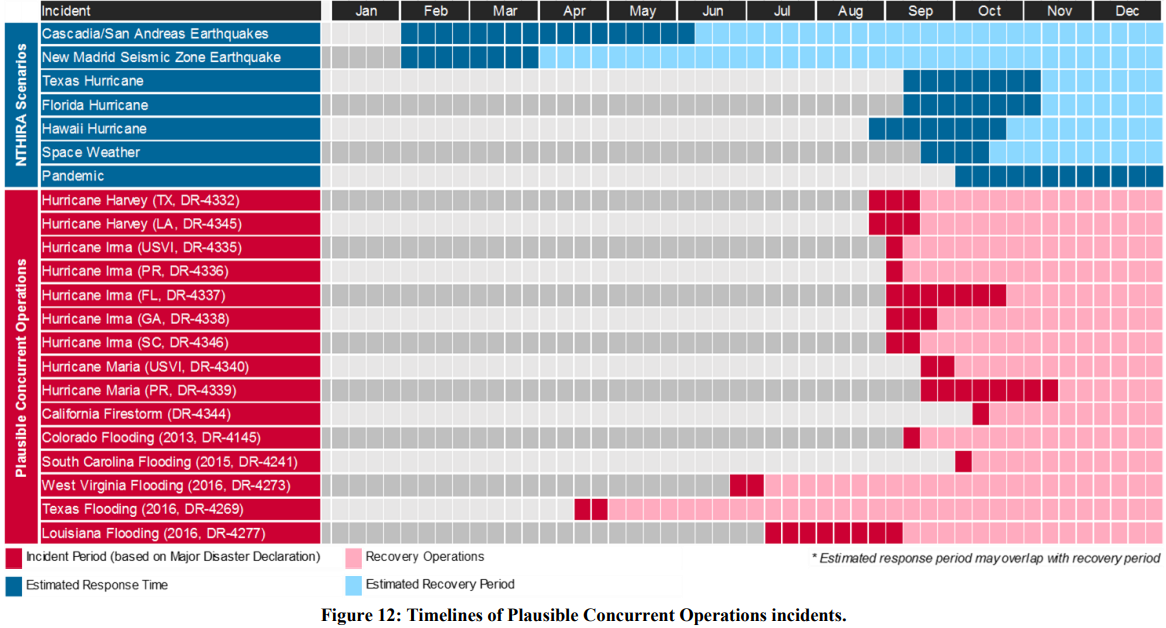
Which sections of the San Andreas are most likely to rupture? There are some assumptions, however, seismology is still a fairly young science. Researchers are learning all the time… and sometimes, faults surprise us.
The image and quote below come from a 2017 article, “Where the San Andreas Goes to get away from it all,” by Dr. Chris Rollins. Previously with CalTech at the time of this article, Dr. Rollins is now a researcher with GNS Science in New Zealand.
“It is commonly thought that the fault properties of the creeping section favor stable sliding and essentially kill off earthquakes that propagate into it – as evidenced by the 1906 earthquake’s end at San Juan Bautista. These same fault properties should in theory prevent earthquakes from nucleating (originating) in the creeping section, or at least from reaching magnitudes larger than 5 or so if they do.
However, the shallowest portion of the Japan Trench offshore east Honshu was thought to have the same earthquake-killing fault properties, and to slip gradually and stably, until it slipped 50 meters in a few seconds during the 2011 M=9.0 Tohoku-oki earthquake, directly causing the devastating tsunami that followed…
The question in California, if this hypothesis is true, is whether an earthquake rupturing towards San Juan Bautista from the north, such as the 1906 San Francisco earthquake, could rupture clean through the creeping section and continue past Parkfield into southern California as a result of the same mechanism.”
Portland State University research, Central Cascadia Subduction Zone Creep, states that “The Cascade thrust under central Oregon may be partially creeping for at least 6500 years”. It’s worth noting that the Cascadia Subduction Zone has had full-margin ruptures during that time, so the creep may not prevent a full-margin rupture in the next go-round.
Imagine for a second that:
- The Northern San Andreas Fault with its potential to produce an M7.9 ruptures and doesn’t stop at the “creeping” section
- Instead, it flows through to meet with the Southern San Andreas Fault (or visa versa) with its potential to produce an M7.8.
- Taking into consideration the extra miles between
- While remembering that magnitude is essentially a function of rupture length…
The earthquake could be quite large. A reminder, the full length of San Andreas is ≈800 miles whereas Cascadia is “only” 621 miles. Food for thought.
| Saddle Mountain (estimated Mw 7.3) and Seattle fault (estimated Mw 7.5): Mainshocks between late fall 923 CE and early spring 924 CE, rupturing within 6 months of each other. (these may have ruptured as a single, larger event (estimated Mw 7.8) | Ansei earthquake pair along Japan’s Nankai subduction zone: Mainshocks in December of 1854, occurring 32 hours apart. |
| New Madrid, USA, sequence: Mainshocks on December 16, 1811, January 23, 1812, and February 7, 1812. | Herat earthquake sequence: 2 earthquakes on October 7, 2023, a third on October 10th and a fourth on October 15th, each measuring Mw 6.3. According to this Temblor article, “It’s unlikely that these four events happened so close together just by chance. It’s far more likely that the earthquakes are triggering each other, like a chain of dominoes being pushed over. When an earthquake occurs, the stress released by the event can be transferred to surrounding faults via coulomb stress transfer.” |
| East Anatolian fault zone (estimated Mw 7.8) and the adjacent Sürgü fault (estimated Mw 7.5): Mainshocks on February 6, 2023, ruptured 9 hours apart |


| Denali earthquake in southern Alaska: 2001 Mw 7.9 | Landers earthquake in southern California: 1992 Mw 7.3 |
| New Zealand Kaikōura earthquake: 2016 Mw 7.8 (involved more than 20 distinct faults) | San Andreas Fault and the San Jacinto Fault rupture together 20% – 23% of the time |
It’s possible. And both events happening together would make response times longer, resources scarcer. Be the hero of your story and spend some time this week working on your family’s 2-weeks-ready plan. You’ve got this!
