How often do Cascadia megathrust earthquakes occur? A quick Google search turns up a few different answers from the experts (examples can be viewed at the bottom of this page).
- Most commonly found answer: Cascadia megathrust earthquakes occur every 300 to 500 years.
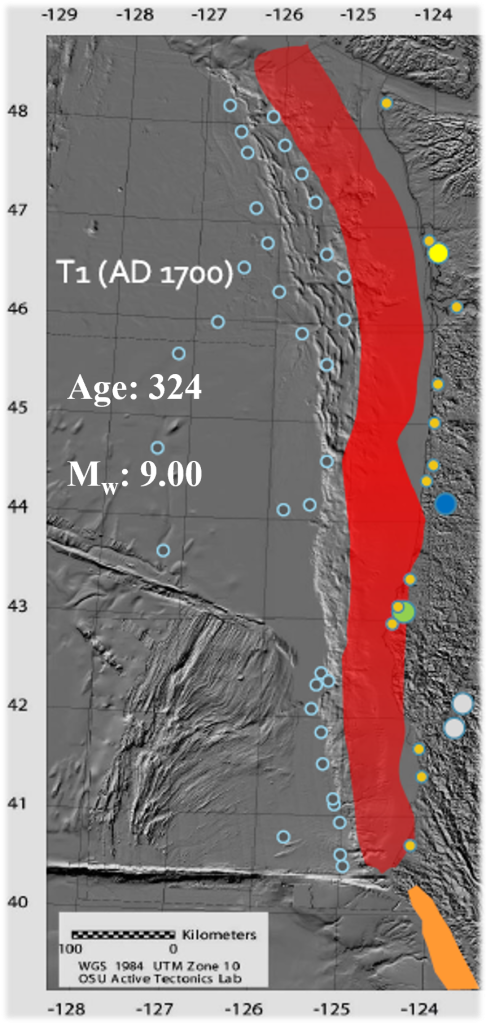
- Number of years since the last major Cascadia quake: 324 years (which occurred January 26th, 1700)
As with Surviving Cascadia’s Likelihood of an 8.0 page, it comes down to Risk Perception: someone’s subjective judgment of the likelihood of an event, situation, or outcome. Hearing the two bulleted facts above creates a risk perception much like the graphic below — as if the Pacific Northwest is still hovering around the beginning of that normal range.

That graphic sends a pretty loud perception message. We start to think, “The Cascadia earthquake and tsunami are probably not all that likely to happen in my lifetime.”
Unfortunately, the graphic provides a devastatingly skewed perception that has the potential to provide a false sense of security, in a way. And it matters because…
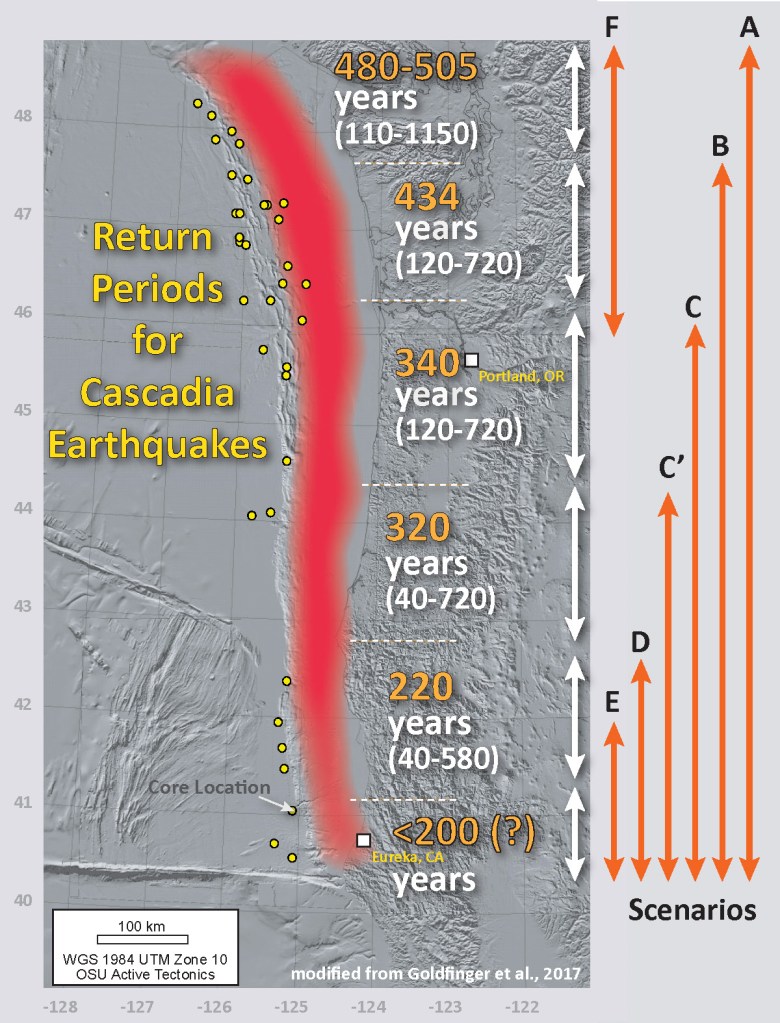
The reality is more complicated than a simple “every 300-500 year” statement. That timeframe doesn’t refer to the frequency of events in the region as a whole. It’s a matter of geography, as shown in this image from the Oregon State University Active Tectonics Lab. (Goldfinger et al. 2016)
Southernmost Segment
- Throughout the past 10,000 years, every Cascadia megathrust earthquake occurred in the southernmost region of the fault.
- As shown in this image, the average timespan between earthquakes is 1 event every ≈220 – 230 years in this region.
- Reminder: The Pacific Northwest has already gone 324 years since the last event.
Moving North
- Segments to the north, however, aren’t always included in the action.
- In other words, event frequency decreases as you move north so the likelihood is less if you live in British Columbia than it is if you live in southern Oregon.
- Events average 1 every ≈480 – 505 years in the northernmost segment.
- This is where the “500-year average interval” comes from in the 300 – 500 year statement. But again… that’s statistic that applies to the fault as a whole, just a certain section of the fault.
- Cascadia earthquakes that stretch to the northernmost section are the largest (magnitude 9 range) and occur during about half of all Cascadia megathrust events. (Image Credit: Jason Robert Patton)
Events that don’t stretch the full distance to the north are partial ruptures (magnitude 8 range).
References for this data and graphics showing the size of each event over the past 10,000 years can be found near the end of this page. *These recurrence intervals cover 10,000 years of history. As such, earthquake T19, estimated to have occurred 10,200 years ago, is not included.

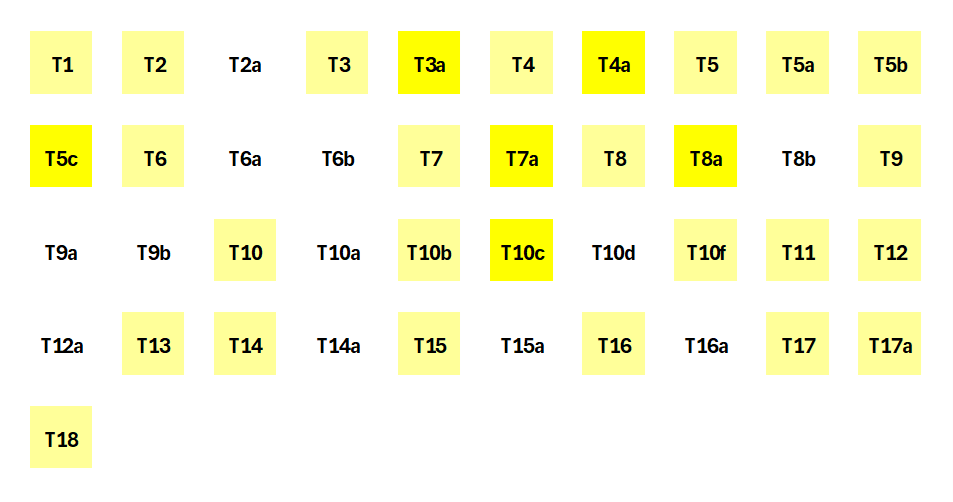
20 events (highlighted below) ruptured the entire length of the fault along the Cascadia margin (full-margin ruptures).
10,000 years / 20 events ≈ one event every 500 years in this northernmost segment.

23 events ruptured from Cape Mendocino, CA up to about Oil City, Washington.
Includes the 20 events that reached the northernmost segment (highlighted in light yellow) and 3 additional events that reached “only” as far north as Oil City, WA (highlighted in bright yellow).
10,000 years / 23 events ≈ On average, one event every 434 years reaches this far north.


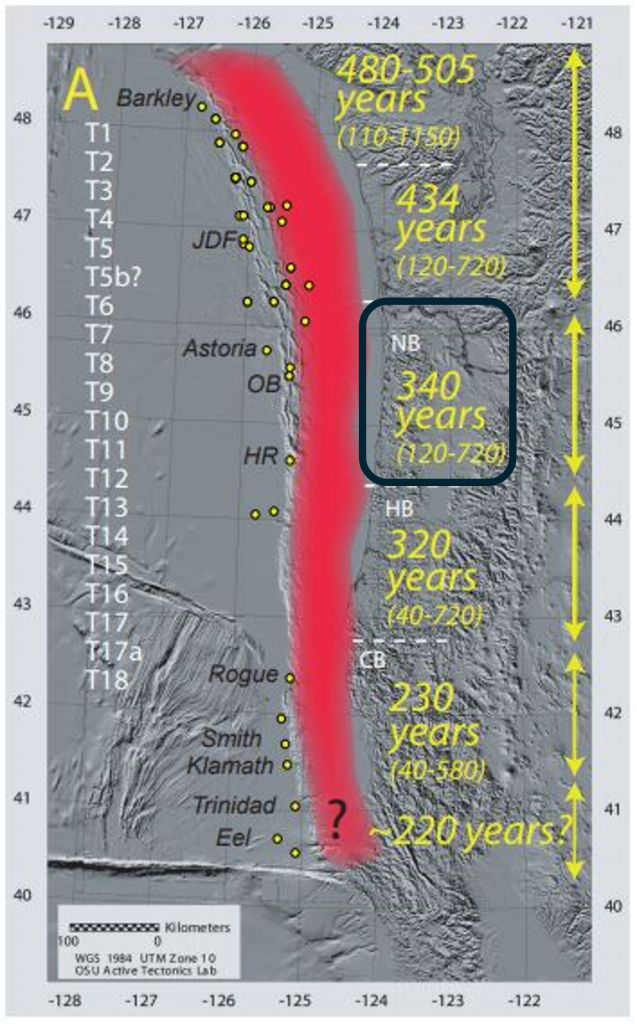
29 events ruptured from Cape Mendocino, CA up to about the mouth of the Columbia river.
Includes the 23 events that reached the two northernmost segments (highlighted in light yellow) and 6 additional events that reached “only” as far as the Columbia river (highlighted in bright yellow).
10,000 years / 29 events ≈ On average, one event every 345 years reaches this far north.
31 events ruptured from Cape Mendocino, CA up to Alsea Bay, OR.
Includes the 29 events that reached the two northernmost segments (highlighted in light yellow) and 2 additional events that reached “only” as far as Alsea Bay, Oregon (highlighted in bright yellow).
10,000 years / 31 events ≈ On average, one event every 322 years reaches this far north. The region is right at this average (324 years).


ALL 41 events ruptured in these two southernmost segments. There are even 4 additional “potential” events in the southernmost segment, though there is some uncertainty as to whether those 4 are officially “Cascadia” ruptures. They are the smallest 4 in the set and with that reduced size, may have been ruptures along the Northern San Andreas Fault (NSAF) or Gorda fault.
That said, there is evidence that they occurred and they would effect the area, should an event like that occur again. Adding them in here, we expand the total events from 41 to 45.
10,000 years / 45 events ≈ On average, one event occurs every 222 years in the southernmost segment. If only the 41 are taken into account, the southern region experiences an earthquake once every 243 years, on average (10,000/41).

Nearly 15 years ago, Oregon State University professor emeritus Chris Goldfinger said, “We can now say that we have already gone longer without an earthquake than 75 percent of the known times between earthquakes in the last 10,000 years.” Since that quote was published in 2010, additional intervals have been passed. We have now gone longer than:
- 80% of known times between earthquakes in the last 10,000 years
- 93% of known times between earthquakes in the most recent 6,000 years
- 20 megathrust earthquakes (magnitudes 8s and above) have occurred in the most recent 4,000 years. None of the intervals between them stretched beyond 300 years. In other words, we have currently gone longer than 100% of known times between earthquakes during the most recent 4,000 years
- It has been 324 years since the last event.
- Overall, 27 of the 41 intervals were less than 300 years in length. So when we tell ourselves the story of how often these earthquakes occur in the Pacific Northwest, it may be more accurate to say:

“The recurrence time varies from subduction zone to subduction zone. In the Cascadia subduction zone, 13 megathrust events have been identified in the last 6000 years, an average one every 500 to 600 years.”
–Government of Canada
“The best available evidence indicates that these earthquakes occur, on average, every 500 to 600 years. However, the years between these events have been as few as 100 to 300 years.”
-Cascadia Region Earthquake Workgroup (CREW)
“At Cascadia, big quakes are believed to come roughly every 500 years, give or take a couple hundred.”
– Columbia University
“Paleoseismology, the exploration of evidence of ancient quakes from rocks, has become a cottage industry here and suggests that a major (i.e. megathrust) quake occurs every 500 years on average.”
–Portland State University
“Geological evidence indicates that such great earthquakes have occurred at least seven times in the last 3,500 years, a return interval of 400 to 600 years.”
-Pacific Northwest Seismic Network (PNSN)
“The offshore Cascadia subduction zone produces great earthquakes every 300–500 years that generate tsunami that inundate the coast within minutes.”
-USGS
“Researchers suggest that we are within the roughly 300- to 500-year window during which another large Cascadia event may occur.”
-Scientific American
“The expected recurrence interval for large earthquakes in this region is 300-500 years.”
-Berkeley Seismology Lab
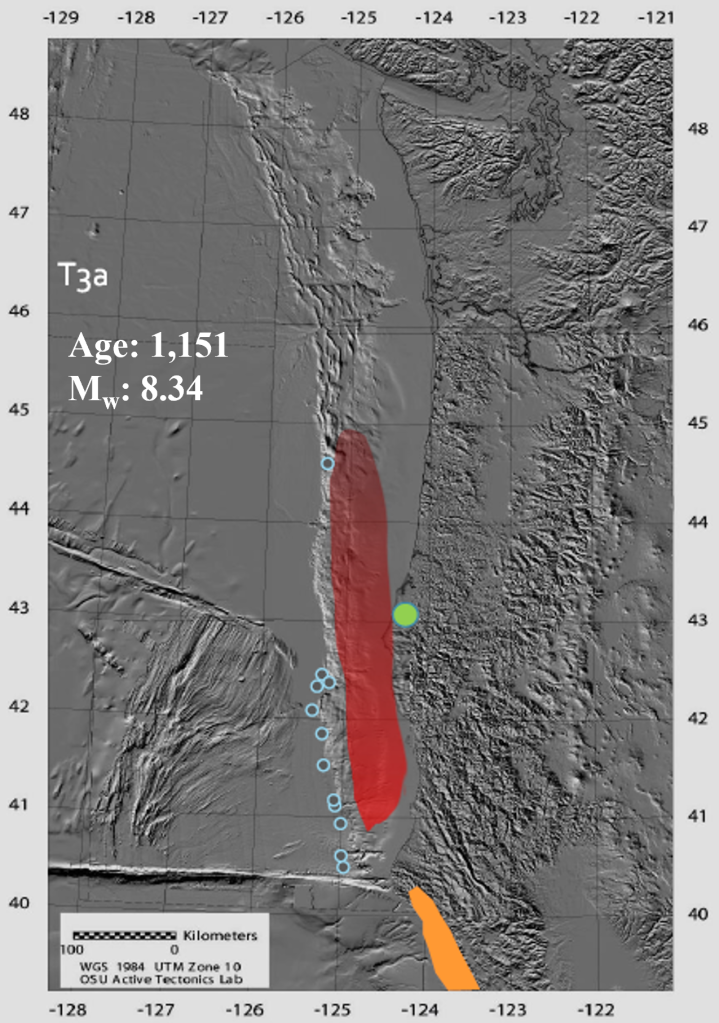
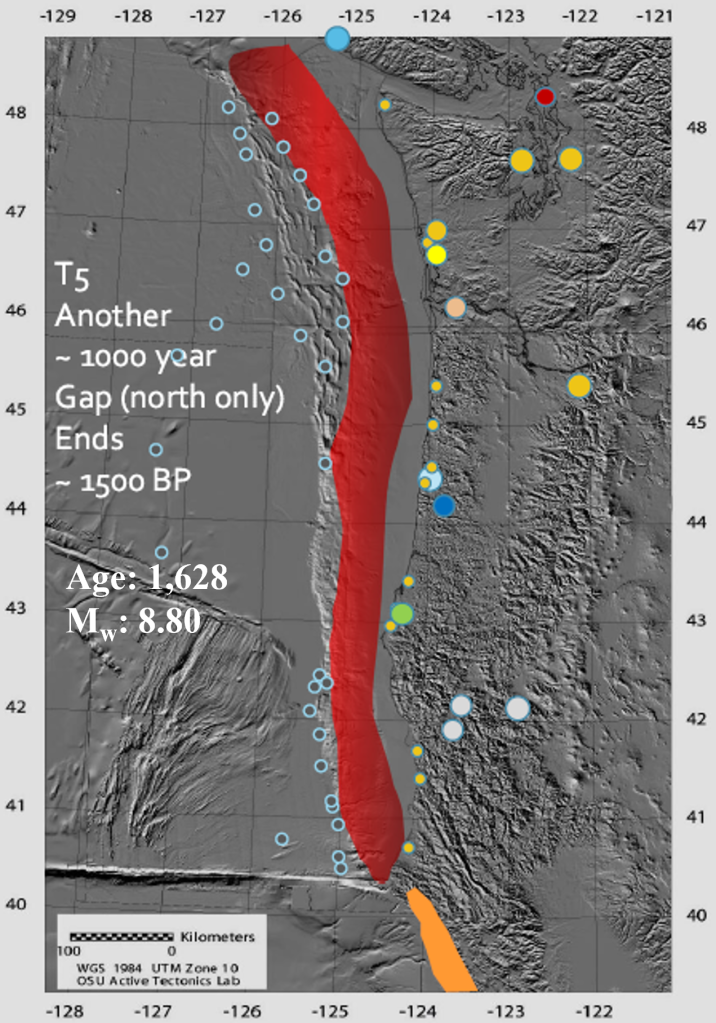
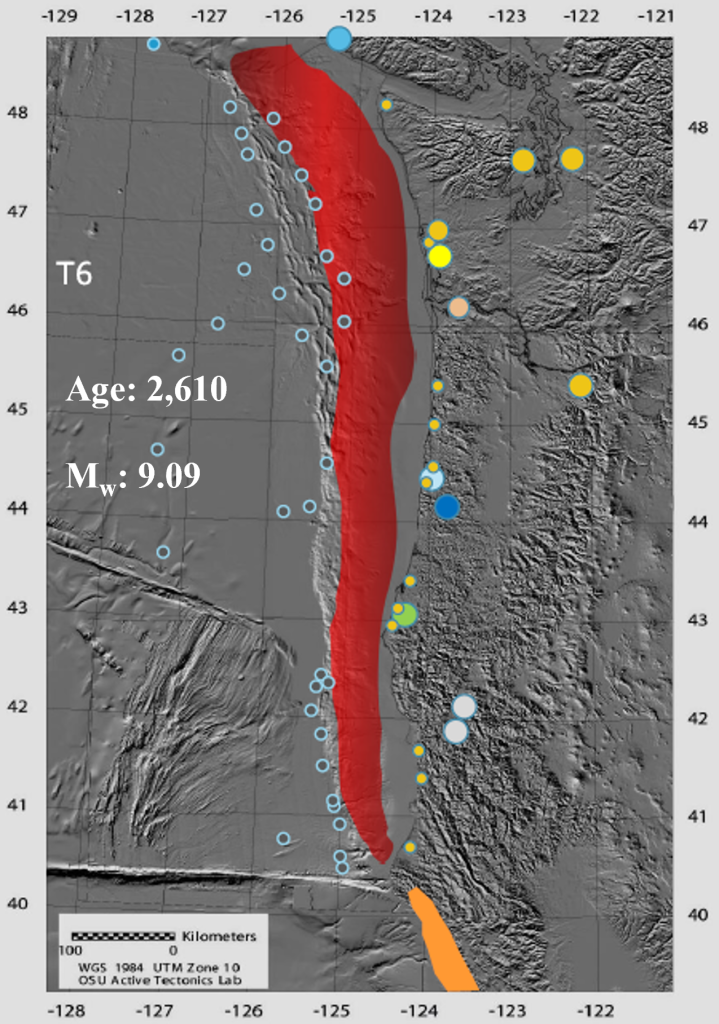
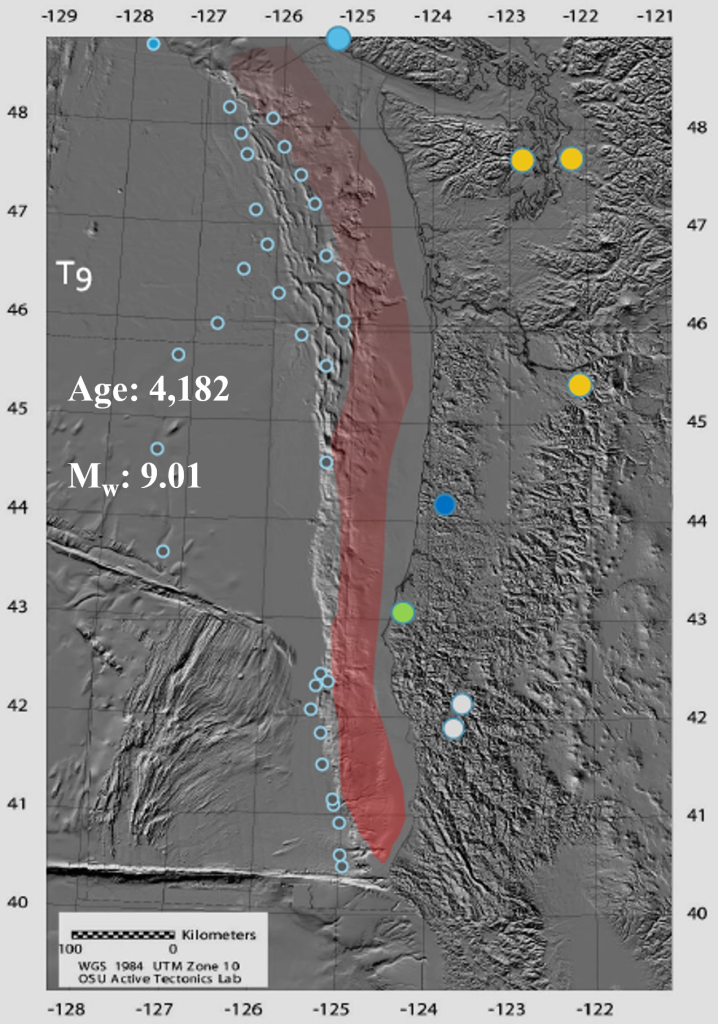
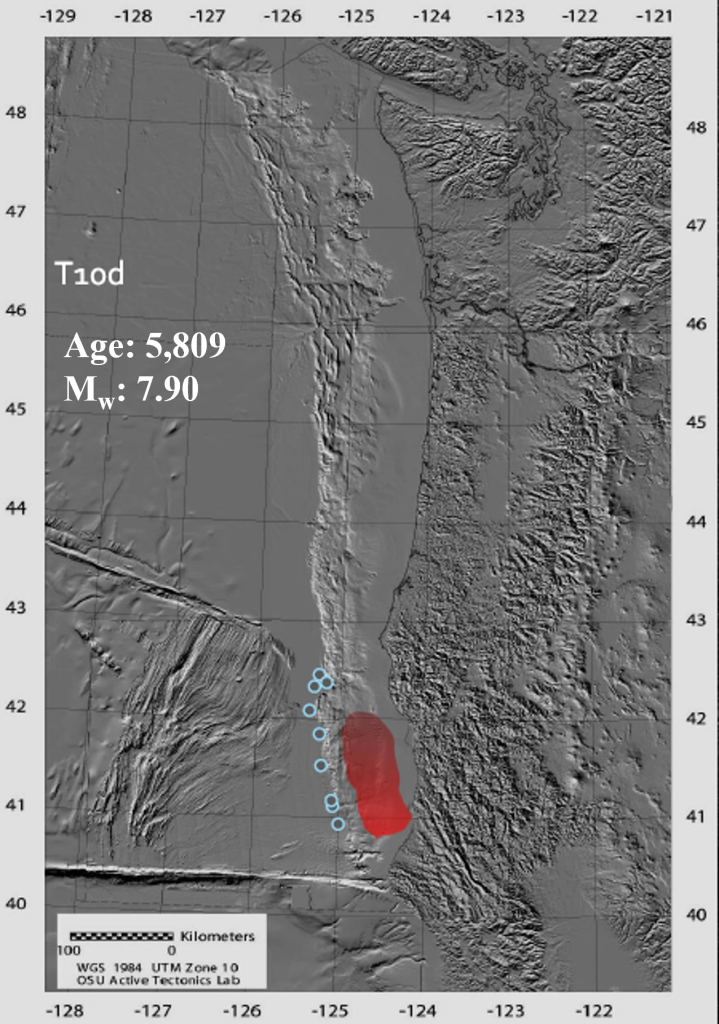
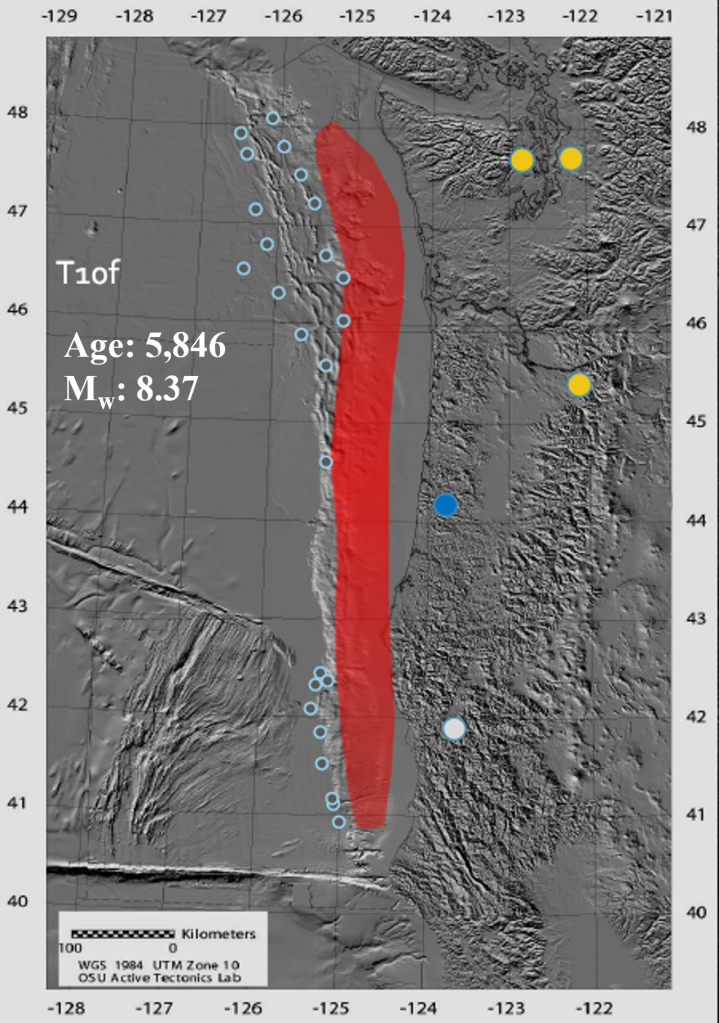
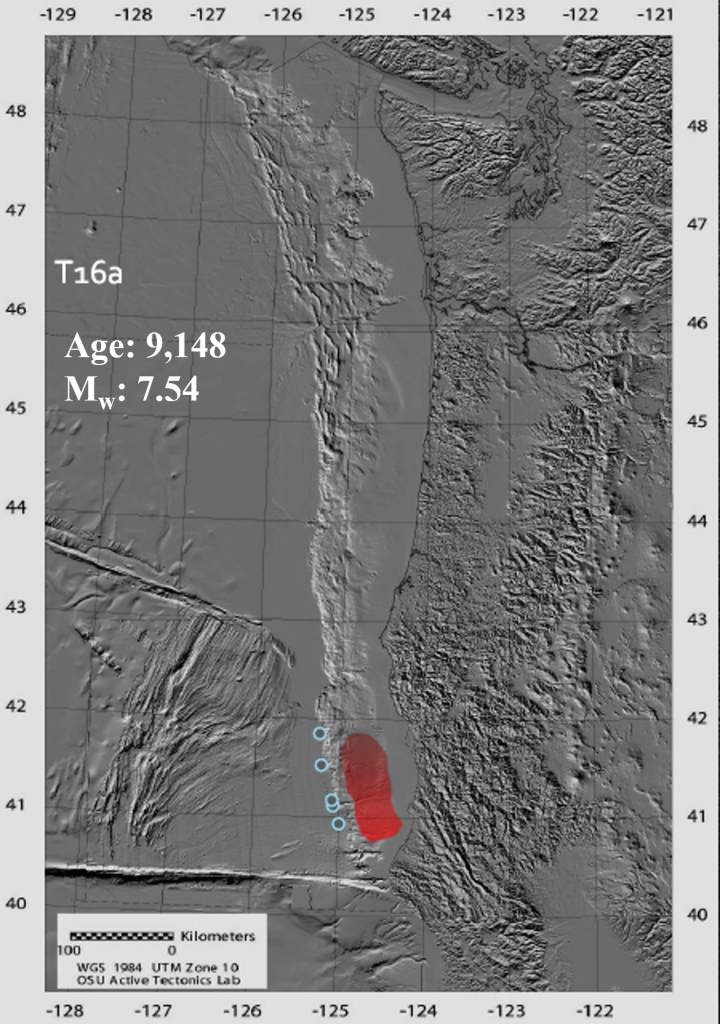
The following images are part of a PowerPoint presentation saved to the Oregon Legislative Information System (OLIS) website. The White letters near the upper left of each image are Cascadia earthquake event “names” (example: T1). According to the slide deck, “Event pulses that correlate at all sites are shown by flashes of the “locked zone” in red. Event “size” shown by the intensity of red shading.” In other words, the images basically show how much of the fault “unzipped” in each event and the intensity of that event. T11 was the biggest on record.


Goldfinger, C., et al., The importance of site selection, sediment supply, and hydrodynamics: A case study of submarine paleoseismology on the northern Ca…, Marine Geology (2016), http://dx.doi.org/10.1016/j.margeo.2016.06.008
Goldfinger, C., Galer, S., Beeson, J.W., Hamilton, T.S, Black, B., Romsos, C., Patton, J., Nelson, C.H., Hausmann, R., Morey, A., 2016, The Importance of Site Selection, Sediment Supply, and Hydrodynamics: A Case Study of Submarine Paleoseismology on the Northern Cascadia margin, Washington USA, Marine Geology in press/online.
https://olis.oregonlegislature.gov/liz/2017R1/Downloads/CommitteeMeetingDocument/101701
