Have you ever wondered how strong the shaking could be during the next Cascadia megathrust earthquake? Like most things in the seismic landscape, the answer is complex. Up until recently, many publications included shake intensity maps for risk analyses were based on average potential ground motions. The M9 Project (magnitude 9) — 50 simulations of the ‘Really Big One’ show how a 9.0 Cascadia earthquake could play out — provides a wider prospective on the range of possible outcomes. The research was conducted in a coordinated effort with the University of Washington, United States Geologic Society (USGS) and the National Science Foundation (NSF).
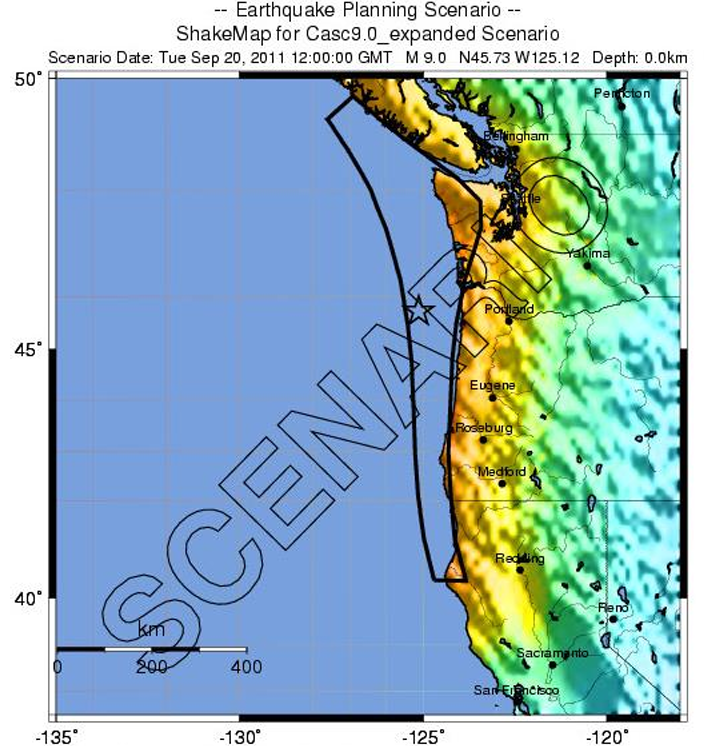
The M9 research states, “To date, scenario documents (Cascadia Region Earthquake Workgroup [CREW], 2013), risk analyses (National Infrastructure Simulation and Analysis Center [NISAC], 2011; Regional Resiliency Assessment Program [RRAP], 2019), and emergency planning exercises (Paci-Green et al., 2015) have used ground-motion intensities from an M 9.0 Cascadia earthquake scenario ShakeMap that is based on empirical GMMs derived from global earthquake data (see Data and Resources). Although invaluable, the existing Cascadia earthquake scenario assumes that shaking will be identical along the length of the rupture zone for a given site condition and distance from the fault. These scenarios do not accurately capture important effects that impact ground shaking, such as rupture directivity and amplification from deep sedimentary basins.
Furthermore, as its name suggests, this ShakeMap represents a single earthquake scenario.
However, a range of possible ground motions may be expected depending on the earthquake’s rupture characteristics (e.g., hypocenter location, down-dip extent, slip distribution; Wirth, Frankel, et al., 2018).”3
Based on the range of possibilities, the M9 project team chose a set of 30 earthquake scenarios from the original 50 simulations. “[The set] was designed to exhibit a range of possible ground-shaking outcomes by varying properties.” 3 The properties varied were, “Hypocenter Location (i.e. starting point), Down-dip Rupture Limit (i.e. the inland, eastward extent), Slip Distribution, Subevent Location (i.e. the location of strong ground motion generating areas or “sticky patches”)4
The research found, among other findings, the following:
- “Overall, the results confirm that coastal areas would be hardest hit, and locations in sediment-filled basins like downtown Seattle would shake more than hard, rocky mountaintops. But within that general framework, the picture can vary a lot; depending on the scenario, the intensity of shaking [at a given location] can vary by a factor of 10.” 2
- “A [Cascadia] earthquake where the rupture extends deep and partially inland is weighted at 30%, a shallow rupture that is entirely offshore is weighted at 20%, and a mid-depth rupture that extends approximately to the coastline is weighted at 50%.”1
- “The collapse risk of modern reinforced concrete shear wall buildings in the M9 CSZ to be larger than anticipated.”4
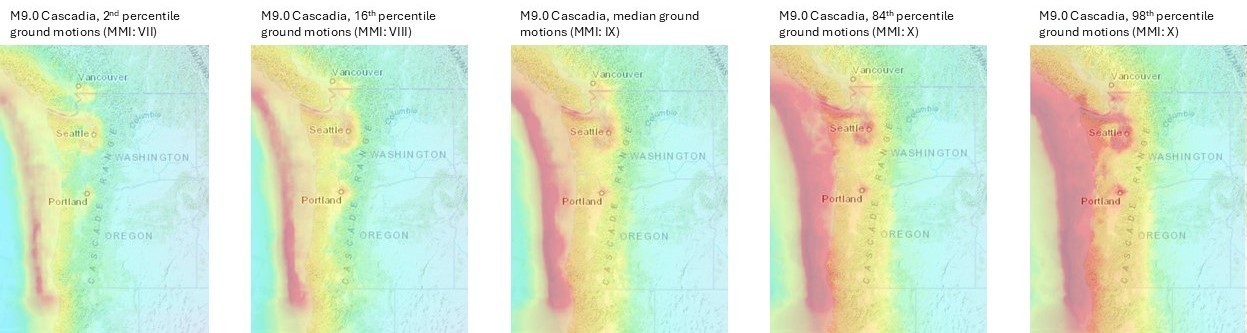
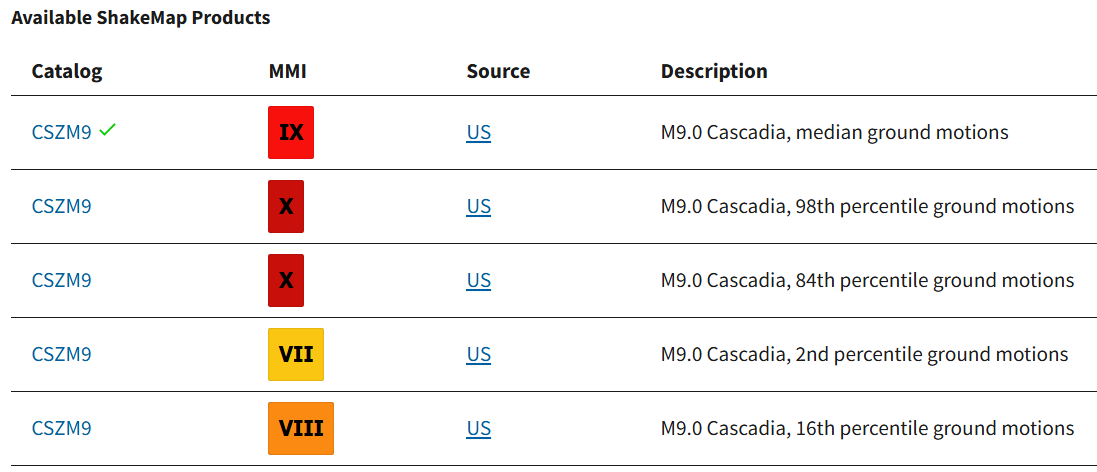
Those 30 simulations that showed the range of possibilities were compiled into a set of 5 that are available to the public. You can visit the USGS M 9.0 Scenario Earthquake – M9.0 Cascadia main page to see the map that displays median/50th percentile ground motions.
To view the range of what’s possible, start from that page, click on ShakeMap tile and then click the grey bar labeled, “View all shakemap products (5 total).” Clicking a scenario will change the map below. You can then click on the map to open it and zoom in to any location you are curious about. Then click on a location within the map and it will provide a pop up.
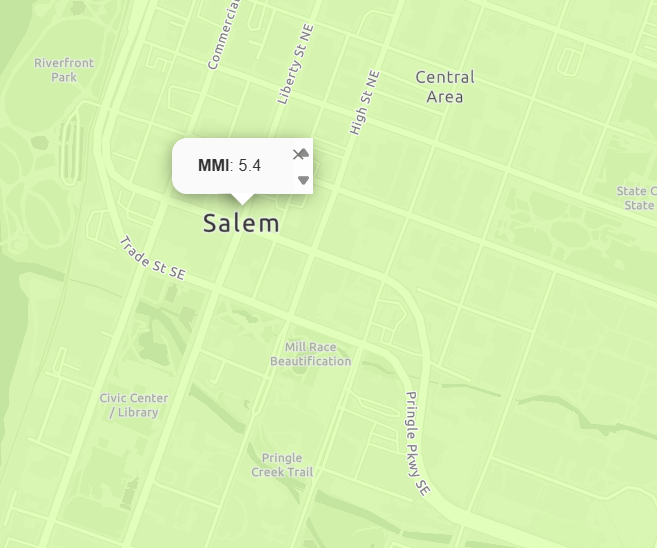
Take, for example, downtown Salem, Oregon. If this location experienced ground motion (shaking) intensity in only the 2nd percentile of what’s possible (the lightest shaking possible among the 5 scenarios), an M9 would create shaking equal to an M5.4 in the heart of Salem. Keep in mind, Salem is located roughly 50 miles inland, which is a good distance from the fault.
However, if you select the opposite end of the spectrum and select the map that displays the 98th percentile of possible ground motions, that same location could experience shaking equivalent to an M7.8.
Running the three other options — 16th, median, and 84th percentiles for ground motions — can allow an individual, a family, a business, or a community to further understand what’s possible.

The ground motions are shown by the acronym MMI, which stands for Modified Mercalli Scale. So what’s the difference between magnitude (M9) and MMI?
- “Magnitude scales, like the moment magnitude, measure the size of the earthquake at its source.” – USGS “Magnitude is expressed in whole numbers and decimal fractions. For example, a magnitude 5.3 is a moderate earthquake, and a 6.3 is a strong earthquake. Because of the logarithmic basis of the scale, each whole number increase in magnitude represents a tenfold increase in measured amplitude as measured on a seismogram.” – USGS
- “Intensity scales, like the Modified Mercalli Scale and the Rossi-Forel scale, measure the amount of shaking at a particular location.” –USGS
The USGS provides the following image to explain the Modified Mercalli Intensity (MMI) Scale.
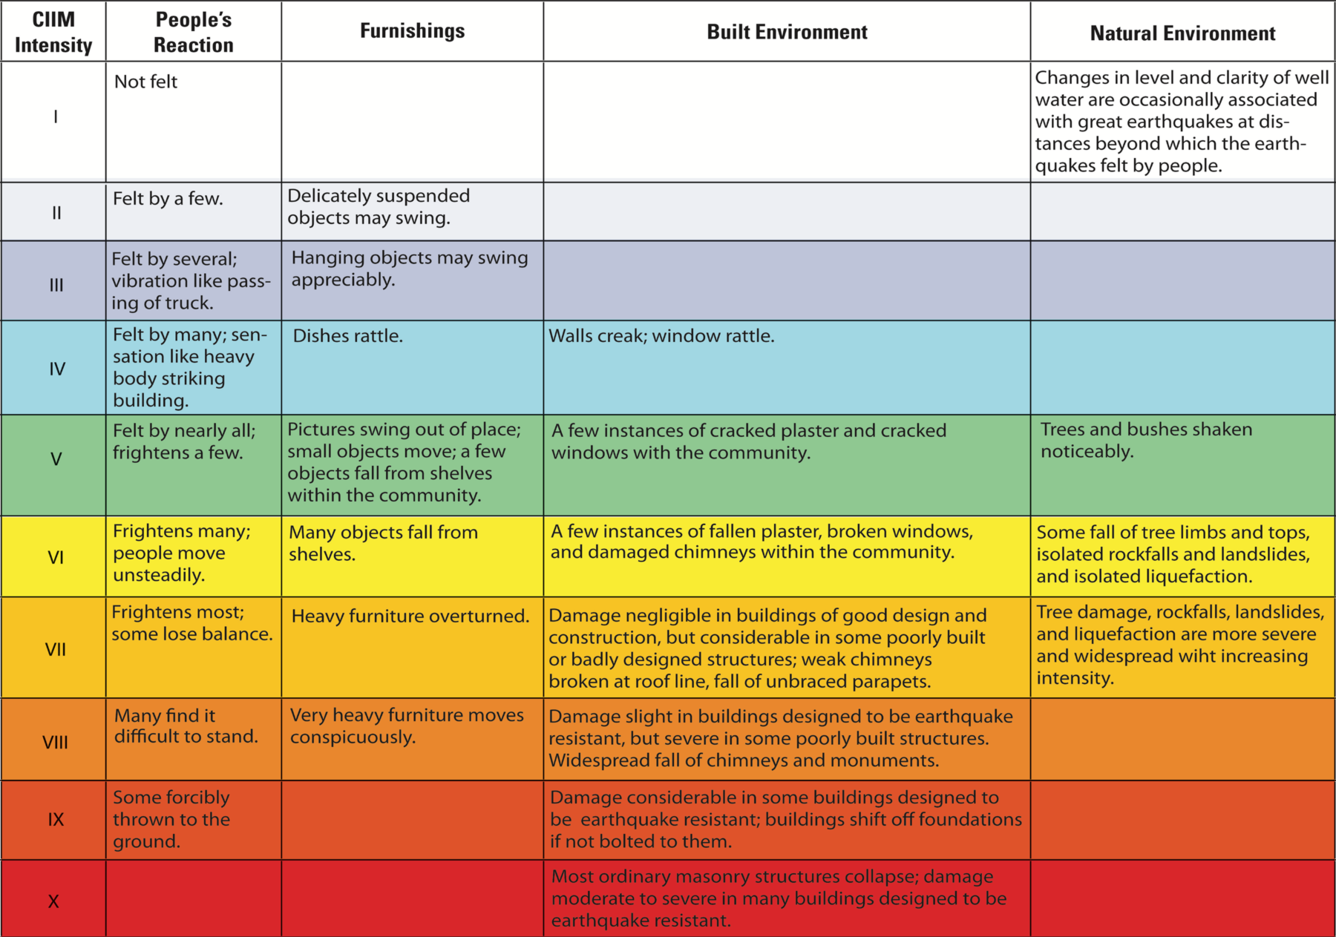
This PDF comes from Columbia University and can be found here: Microsoft Word – Shortened_Mercalli_20may08.doc
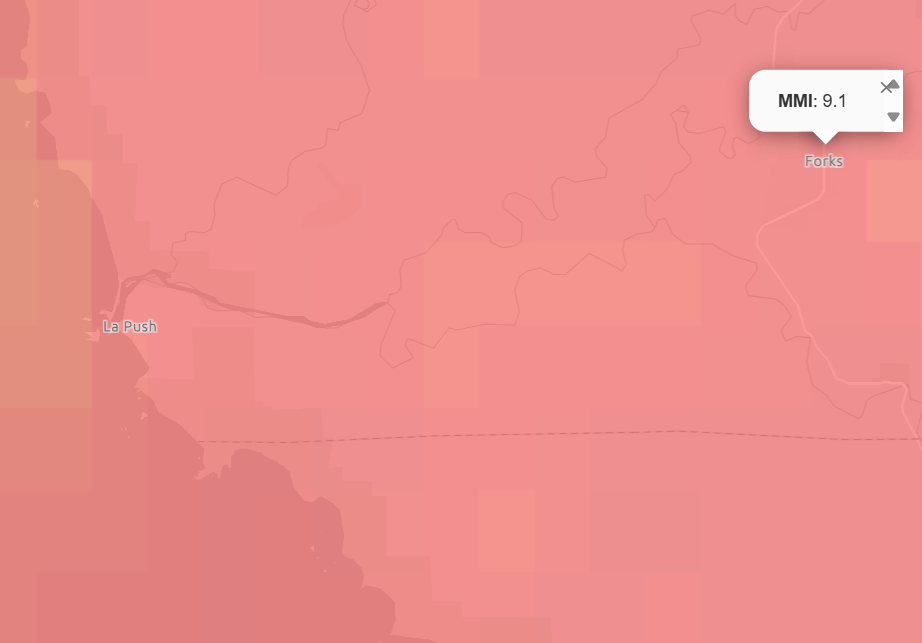
Running the 2nd percentile against the 98th percentile for Forks, Washington — the location made famous by Stephenie Meyer’s Twilight books that were optioned for film — shows much higher shaking potentials than in Salem. Use the maps to zoom into areas you frequent to see what’s possible.


Neah Bay, Washington could experience ground motions equivalent to an MMI of 10!
Of note, magnitude was not varied in these scenarios. Scenarios could be run for other magnitudes (8.4, 8.9, 9.1, etc) to add to the complexity. However, each scenario takes roughly 2 days to process, requiring not just time but continued funding.
List of things that increase the impact of an earthquake:
- Magnitude: Measured by the Moment Magnitude Scale: measure of energy released by the earthquake
- Proximity to the hypocenter/epicenter: the closer you are, in general, the stronger the shaking will be
- The depth of seismic activity: closer to the surface = more intense shaking (bigger impact)
- Local geologic conditions: buildings on soft sediment soils will experience stronger shaking
- Density: buildings close together than fail can impact other buildings that may not have & more people are effected in densly populated areas
- Quality of construction: building codes and land use planning are meant to ensure stronger quality of construction to be able to withstand the shaking
- Erin A. Wirth, Arthur D. Frankel; Impact of Down‐Dip Rupture Limit and High‐Stress Drop Subevents on Coseismic Land‐Level Change during Cascadia Megathrust Earthquakes. Bulletin of the Seismological Society of America 2019;; 109 (6): 2187–2197. doi: https://doi.org/10.1785/0120190043
- 50 simulations of the ‘Really Big One’ show how a 9.0 Cascadia earthquake could play out | UW News part of the M9 project
- Wirth, E. A., A. Grant, N. A. Marafi, and A. D. Frankel (2020). Ensemble ShakeMaps for Magnitude 9 Earthquakes on the Cascadia Subduction Zone, Seismol. Res. Lett. 92, 199–211, doi: 10.1785/0220200240. (The online version is behind a paywall, so I’ve attached a copy here)
- M9 Cascadia subduction zone earthquakes and landscapes – how will the hillslopes handle the big one? ASU_M9_compressed
