The impacts of a magnitude 9.0 Cascadia megathrust earthquake hitting the Pacific Northwest can be hard to imagine. What will it be like for families? For businesses? How will the region be affected? This page provides some estimates that help conceptualize the aftermath of this eventual disaster.
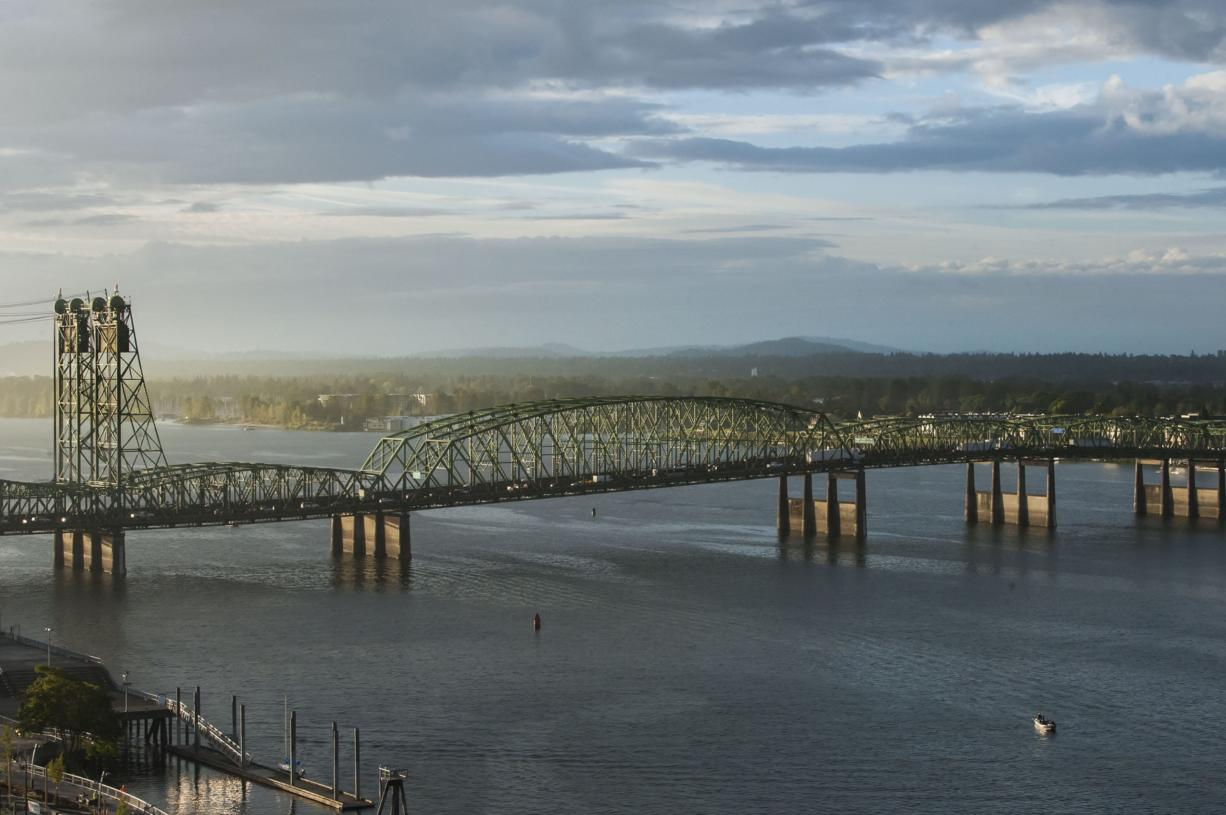
Connecting Portland, Oregon to Southwest Washington over the Columbia river is the I-5 bridge (Image Credit: The Columbian). In its current condition, the bridge is expected to fail in a Cascadia earthquake.
Washington and Oregon have both contributed funds and received additional federal funding to help replace the bridge, but the work hasn’t begun yet.
According to the Statesman Journal, “The bridge — so old that horses were still a main mode of transportation when it opened — now carries more than 130,000 vehicles a day.”
Should the earthquake hit prior to the bridge’s replacement, Transportation Secretary Pete Buttigieg is quoted saying,
“You can see how [the I-5 bridge] is showing its age and how catastrophically disruptive it would be if that bridge was unavailable even for one day. I think you would feel the effects across the country.”
…Across. The. County.
That’s a key point. While this page looks at regional impacts, it’s important to note that our world is interconnected. A regional disaster this large is going to impact supply chains (the flow of things like gasoline, groceries, diapers, medications, etc.) far beyond the region’s boarders. And this bridge is not alone. Portland’s Burnside Bridge, set to be rebuilt beginning in 2027 due to seismic concerns, stretch across Willamette River. This video simulation shows what is expected to happen to the bridge during a 9.0 Cascadia earthquake.
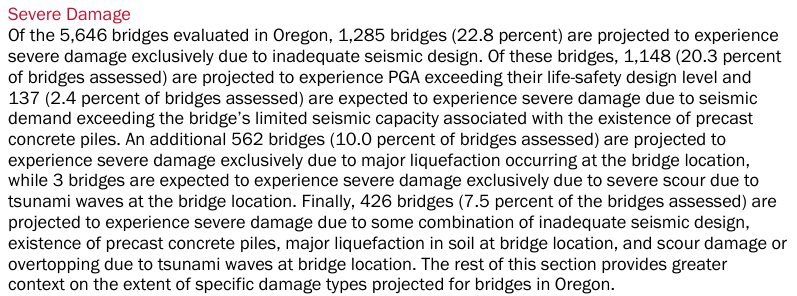
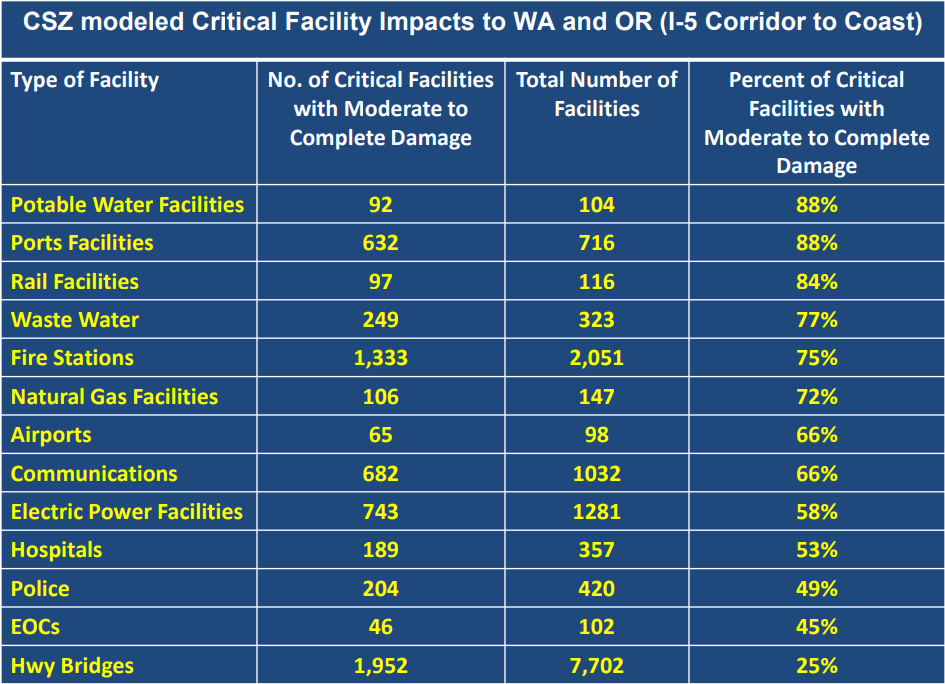
These two bridges certainly won’t be the only ones impacted in a major quake. A 2021 report by the U.S. Department of Energy’s Argonne National Laboratory provides the findings shown in this image. The PDF is below.
Bridges aren’t just critical for response and recovery efforts; many are critical for successful evacuation efforts during the event. Many along the coast are essential for tsunami evacuation, but there are other evacuation situations to consider. For example, a 2025 Oregonian op-ed discusses the importance of building a new bridge across Columbia Boulevard near Portland’s north peninsula. Within the peninsula, roughly 20,000 people are at risk of close-proximity toxic inhalation from fuel released from the CEI Hub during a Cascadia event… and without this new bridge, those on the peninsula may not have a viable evacuation path. Better Energy LLC submitted written public testimony for Oregon HB 2749, which looks to fund the new bridge. There are communities in similar situation up and down the potential impact area. Check out the neighborhood’s Facebook page for additional information.
I highly recommend viewing this document. It covers expected impacts to roads, bridges, air, rail, seaports, water, electric, natural gas, fuel, fire departments, EMS, police, hospitals, schools, hazardous material facilities, communications, buildings, and shelters.
For example, the report provides data showing that 440,000 residential buildings in Oregon and half a million in Washington may be damaged by the earthquake, a quarter of which may be uninhabitable without major repairs. Below are a few more examples.
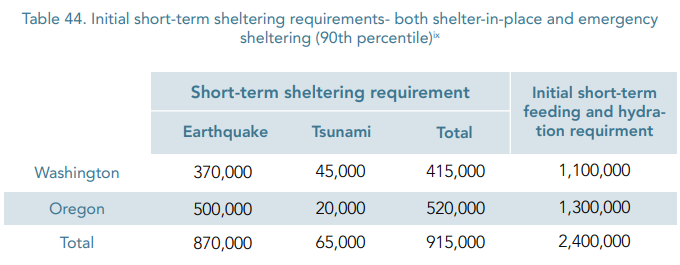
To avoid being one of the 2.4 million who need the initial short-term feeding and hydration (shown above), please work toward getting 2-Weeks-Ready. Be the hero for those around you, too. Visit Surviving Cascadia’s Food Ready, Water Ready, and Life Without Electricity pages as guides to get started. Oregon Emergency Management has a page with several resources, as well.
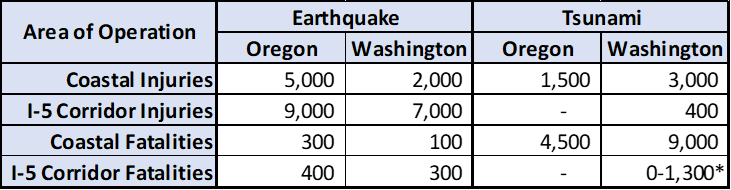

“The highest number of tsunami-related injuries and deaths will likely be in Grays Harbor County, with as many as 5,000 casualties in Ocean Shores alone. The city of Long Beach in Pacific County may also have a high number of tsunami casualties. It is likely that most residents in these communities will not reach high ground before the tsunami wave hits.”
For Oregon, the report states, “The highest number of tsunami-related injuries and deaths are likely in Clatsop County, with over 4,000 casualties in the city of Seaside alone.” Increased planning is advised if you live in these areas.
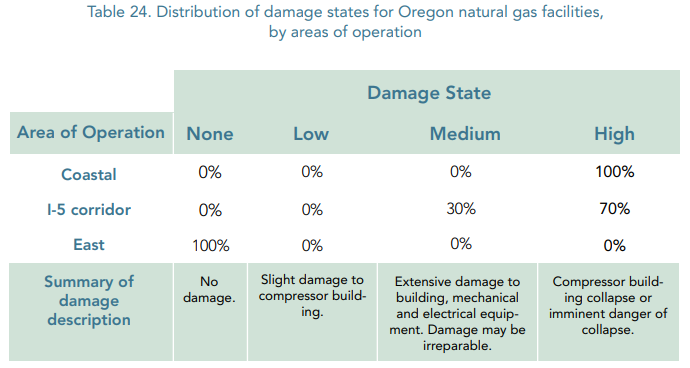
According to the Cascadia Rising Exercise Scenario Document, between 70% and 100% of Oregon’s natural gas facilities will experience a high degree of damage.

Consortium for Emergency Services Technology (CEST) & Idaho Office of Emergency Management
In a presentation by Patrick J. Massey, Director of the National Preparedness Division, which covered the CSZ Earthquake and Tsunami – FEMA/Federal interagency response plan (Published January 2022—532 pages), the following estimates were made (keep in mind, February isn’t the height of tourist season):
- 9.0 Magnitude earthquake occurs in February
- Impacts affecting over 140,000 square miles
- Ground shaking lasts up to 5 minutes
- Numerous aftershocks (several M7.0+)
- 1,100 earthquake-related fatalities
- 13,000 tsunami-related fatalities
- 24,000 injured

Nighttime Versus Daytime Earthquake
If you ask the person next to you if they would prefer the earthquake to happen during the day or at night, chances are, they’ll say daytime. People don’t like the idea of the world crumbling around them… in complete darkness. Turns out, though, a nighttime earthquake is the better option.
In April of 2023, the Federal Emergency Management Agency (FEMA), the National Earthquake Hazards Reduction Program (NEHRP), and the United States Geological Survey (USGS) released the Hazus Estimated Annualized Earthquake Losses for the United States. The West Coast and the New Madrid Seismic Zone carry some of the largest potential financial risks. Mitigation measures can lower this risk.


*Where you find discrepancies between the sources above, note that earthquake scenario assumptions (season, time of day) cause variations in the estimates, and the year the document was written plays a role, as well. Population continues to grow in these regions, affecting the number of people at risk. New assessments are being conducted. New science is being learned. These are just estimates.
