A NOTE ABOUT “OVERDUE”
Before diving into recurrence intervals and earthquake probabilities, it’s worth addressing one of the most common misconceptions: the Pacific Northwest is not considered overdue for a Cascadia Subduction Zone earthquake and tsunami. The region is within the range where another event is possible. It could occur tomorrow, or it could happen 200 years from now.
Cascadia earthquakes don’t occur on a regular schedule. Average recurrence intervals describe the long-term behavior of the fault—not when the next earthquake will happen. Science is not currently able to predict earthquakes. The only certainty is that another Cascadia earthquake will occur someday, and it’s critical that the region continue to move toward resilience in this space.
FULL-MARGIN RUPTURES TELL ONLY PART OF THE STORY
Over the last 10,000 years, geologic evidence indicates that the Cascadia Subduction Zone (CSZ) has experienced ~19 earthquakes that ruptured the entire length of the fault, producing earthquakes of roughly magnitude 9.0. From this record, researchers estimate that full-margin megathrust earthquakes recur, on average, every 500 years, although the intervals vary considerably as shown below (Goldfinger et al., 2016; Nelson et al., 2021).
At first glance, this timeline appears to show a staggering 1,190-year gap between earthquakes. This bar graph contains data for full-margin ruptures only. However, scientists have identified five partial ruptures that occurred during that gap (more on partial ruptures in a minute). Similar situations exist for the other gaps shown.
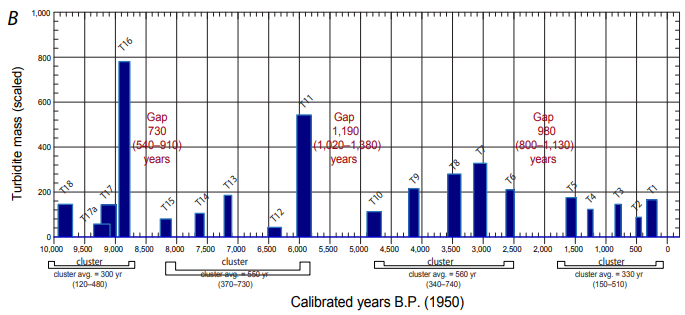
The clusters shown above are more than just patterns we see in the timeline—they reflect a potential recurring behavior scientists have identified in Cascadia’s earthquake history. Kulkarni et al. (2013) found:
“Results indicate that 13 catalogs exhibit statistically significant clustering behavior, yielding a probability of clustering of 13/20 or 0.65. Most (70%) of the 20 catalogs contain two or three closed clusters (a sequence that contains the same or nearly the same number of events), and the current cluster T1–T5 appears consistently in all catalogs. Analysis of the 13 catalogs that manifest clustering indicates that the probability that at least one more event will occur in the current cluster is 0.82.”
LOOKING BEYOND MAGNITUDE 9 EARTHQUAKES
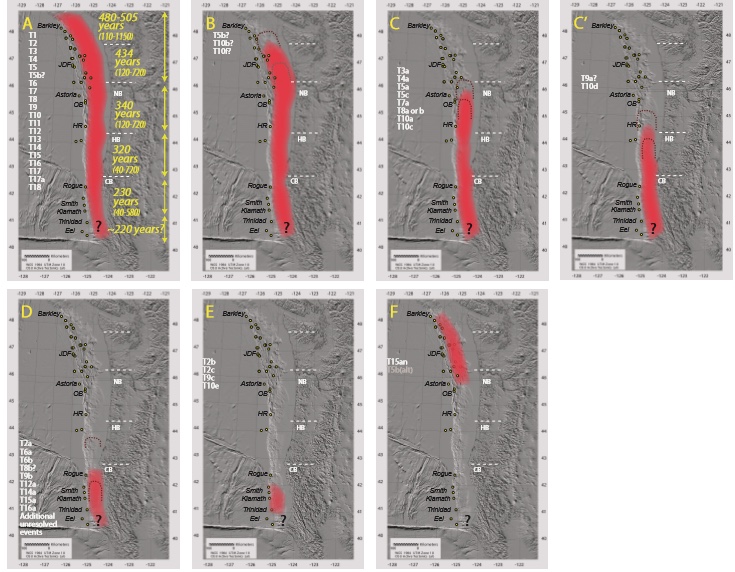
In addition to the full-margin ruptures shown here in Segment A, scientists have identified approximately 23 partial ruptures affecting other portions of the fault (Segments B–F). Most occurred along the southern Cascadia margin, extending through northern California and southern Oregon (Goldfinger et al., 2012).
When both full-margin and partial ruptures with magnitude 7.5 and above are included, the average interval between Cascadia earthquakes is approximately 233 years. For magnitude 8–9 earthquakes (removing magnitude 7s), the estimated recurrence interval is one event every 330 years (Wirth et al., 2025)
However, these figures represent long-term averages—not a countdown to the next earthquake. When both full and partial ruptures are included, individual recurrence intervals range from less than a century to more than five centuries. Recurrence intervals help us understand Cascadia’s past, but they are only one piece of the puzzle. Before returning to the question of where the current 326-year quiet period falls within Cascadia’s earthquake history, let’s first examine the probability estimates scientists have developed for the next event.
So what are the chances of another Cascadia earthquake occurring during our lifetimes? The answer depends on which part of the fault is being considered, whether researchers are estimating full-margin or partial ruptures, and the statistical methods used. As a result, published probabilities can differ substantially. Stein et al. (2017) provides an excellent overview of why these estimates vary. This Central Oregon Geoscience Society (COGS) interview (beginning around the 1:02:00 mark) also offers a clear explanation with helpful visuals.

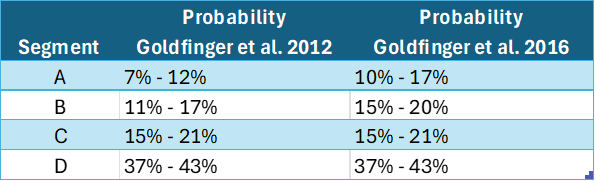
One of the most commonly referenced Cascadia earthquake probabilities is the “37% chance in 50 years” estimate from Goldfinger et al. (2012). This calculation was based on time-dependent probabilities derived from the paleoseismic record. The paper states: “Time-dependent probabilities are similar for Northern margin events at ~7–12 percent [for full margin ruptures] and 37–42 percent in 50 years for the southern margin.”
Of interest is the sentence that follows: “Failure analysis suggests that by the year 2060, Cascadia will have exceeded ~27% of Holocene recurrence intervals for the northern margin and 85% of recurrence intervals for the southern margin.”
In a May 2010 Oregon State University news release, Professor Chris Goldfinger observed: “Perhaps more striking than the probability numbers is that we can now say that we have already gone longer without an earthquake than 75 percent of the known times between earthquakes in the last 10,000 years,”
More than fifteen years have passed since that last statement was made, and 2060 is still decades away. So, let’s return to the question of where Cascadia stands today. Rather than looking ahead to a future benchmark, let’s compare the current 326-year quiet period with the earthquake history preserved in the geologic record. The next section explores where today’s interval falls among the past 10,000 years of Cascadia earthquakes.
PUTTING THE CURRENT 326-YEAR GAP INTO CONTEXT
Of the 42 full- and partial-rupture Cascadia earthquakes identified as having occurred in the last ~10,000 years, we can examine the 41 intervals between them using the dates provided in the sources listed in italics below. Eight of the 41 intervals lasted longer than the 326 years the Pacific Northwest has currently gone since the last major Cascadia earthquake on January 26, 1700.
* In other words, the current gap is longer than roughly ~80% of intervals documented in this paleoseismic record.
Although the timing between events is highly variable, the paleoseismic record suggests that recurrence intervals have generally become shorter in recent millennia, as shown in the bar chart below.
* Over the past 6,000 years, the current 326-year interval is longer than about 90% of recorded intervals.
* Looking only at the last 4,000 years, it exceeds approximately 95% of the intervals observed.

*Note: Goldfinger et al. (2012) revised their 2012 findings in Goldfinger et al. (2016), reducing some of the average recurrence intervals in the northern CSZ segments. The most current age estimates, based on new dating methodology, are provided in the Supplemental Material of Goldfinger et al. (2025). To view the most current magnitude estimates for these events, view the farthest two columns on the right of Table 3 in Rong et al. (2014).
EXPLORING THE PROBABILITIES
Probabilities over a 50-year timeframe can be hard to internalize. This section allows you to input different timeframes, so you can find answers to questions like those listed below.
* How does the probability change over time (on each January 26th anniversary, for example)?
* What’s the likelihood of the earthquake occurring 1) by the time I retire, 2) by the time my kids graduate high school, or 3) by the time I start my own business, etc.?
To explore how these probabilities change over time, download the Excel worksheet below, generously provided by Oregon State University Professor Emeritus Chris Goldfinger and his team. Edit the “Start Year” and/or “End Year” fields (shown in red) to see how the calculated probabilities (shown in blue) change for different time periods.
The Log Normal output, highlighted in yellow below, is the rounded calculation behind the often-cited 37% probability of a Cascadia event occurring within a 50-year timeframe. Hint: If you keep the timeframe at 50 years, the probability changes very little over time. For comparison, try entering 1958–2008 and 2095–2145 as the start and end years for two different 50-year outlooks.

REFERENCES
Wirth, E., Frankel, A., Sherrod, B., Grant, A., Dunham, A., Stone, I., and Grossman, J., Earthquake probabilities and hazards in the U.S. Pacific Northwest, U.S. Geological Survey Fact Sheet 2025–3050, Version 1.1 (2025), https://doi.org/10.3133/fs20253050
Ram Kulkarni, Ivan Wong, Judith Zachariasen, Chris Goldfinger, Martin Lawrence; Statistical Analyses of Great Earthquake Recurrence along the Cascadia Subduction Zone. Bulletin of the Seismological Society of America 2013; 103 (6): 3205–3221. doi: https://doi.org/10.1785/0120120105
Goldfinger, C., Nelson, C.H., Morey, A.E., Johnson, J.R., Patton, J., Karabanov, E., Gutierrez-Pastor, J., Eriksson, A.T., Gracia, E., Dunhill, G., Enkin, R.J., Dallimore, A., and Vallier, T., 2012, Turbidite event history—Methods and implications for Holocene paleoseismicity of the Cascadia subduction zone: U.S. Geological Survey Professional Paper 1661–F
Goldfinger, C., et al., The importance of site selection, sediment supply, and hydrodynamics: A case study of submarine paleoseismology on the northern Cascadia margin, Washington USA, Marine Geology (2016), http://dx.doi.org/10.1016/j.margeo.2016.06.008
Stein, S., Salditch, L., Brooks, E., Spencer, B., and Campbell, M., Is the coast toast? Exploring Cascadia earthquake probabilities, GSA Today, v. 27, no. 11, p. 6–7 (2017), https://doi.org/10.1130/GSATG350GW.1
C. Goldfinger, J. Beeson, B. Black, A. Vizcaino, C.H. Nelson, A. Morey, J.R. Patton, J. Gutiérrez-Pastor, C. Romsos, M.D. Walzcak; Unravelling the dance of earthquakes: Evidence of partial synchronization of the northern San Andreas fault and Cascadia megathrust. Geosphere 2025; 21 (6): 1132–1180. doi: https://doi.org/10.1130/GES02857.1
Rong, Yufang & Jackson, David & Magistrale, Harold & Goldfinger, Chris. (2014). Magnitude Limits of Subduction Zone Earthquakes. Bulletin of the Seismological Society of America. 104. 10.1785/0120130287.
Allan Goddard Lindh; Comment on “Statistical Analyses of Great Earthquake Recurrence along the Cascadia Subduction Zone” by Ram Kulkarni, Ivan Wong, Judith Zachariasen, Chris Goldfinger, and Martin Lawrence. Bulletin of the Seismological Society of America 2016; 106 (6): 2927–2934. doi: https://doi.org/10.1785/0120150069


